

R.W. Stowe
UV applications engineering consultant, Heraeus Noblelight America LLC
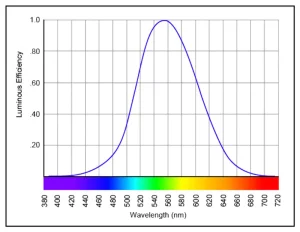
The visible portion of the output (luminous flux) of lamps used for illumination is expressed in lumens, a measure of the total quantity of visible light emitted by a source. This is possible because the output is measured only in the wavelength response range of the human eye. This response is defined as the photopic luminosity function (Figure 1). Illuminance is the luminous flux incident per unit area, measured in lux (lm/m2). So, if a photometer’s response is filtered or electronically weighted to mimic the eye response, its measurement is proportional to the output in lumens. (One will almost always find the output in lumens printed on the package of lighting products.)
As most visible light sources emit radiant energy outside of the visible range, the total radiant output power (radiant flux) of a visible lighting source is expressed in watts. With lumens as a measure of weighted visible output, we can describe the efficacy of lighting products in lumens per input watt (while efficiency is total radiant output watts per input watt).
So, why don’t we just do the same thing to describe the UV output of UV lamps? Because there is no “standard” response curve for reference! Among the many applications and UV technologies, the UV wavelengths of interest are all over the “UV map.” To name a few, organisms, cells, photoinitiators and radiachromic compounds respond to UV, but each in its own range of responsivity, or action spectrum. Consequently, meaningful measurements are made in different wavelength bands of interest, typically defined by upper and lower wavelength.
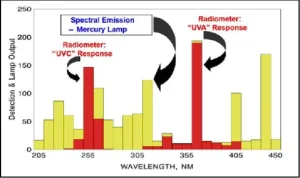
Generally, UV is divided into three spectral regions: UVC (200 to 280 nm), UVB (280 to 320 nm) and UVA (320 to 400 nm). This is convenient, but not precise: These regions are not strictly defined and actually vary in different technologies. [A fourth range is the VUV (100 to 200 nm) or vacuum UV, which does not transmit through air, so is not usually of interest in terrestrial industrial applications.] UV literature is rich with graphs of the spectral distribution of UV sources, including medium-pressure mercury, medium-pressure mercury with additives, low-pressure mercury, amalgam, xenon flash and UV LEDs. The spectral range is anywhere between 200 and 450 nm.
What band of interest would we use to specify radiant exposure? And, what bandwidth? Of course, in UV applications, a combination of photoinitiator response and optical thickness of the film determines the band(s) of interest.
Ideally, the photoinitiator absorption spectra (an indicator of action spectra) would be a guide, but even that gets complex.
The radiant units that we measure are in watts. However, unlike lumens, there is no assumed or defined spectral range. If we select and define the wavelength band of interest by upper and lower wavelength limits, Λ1 to Λ2, we hope to have reproducible irradiance measurements in watts/cm2.
What tools?
Essentially, there are two electronic types of radiometric tools available – spectroradiometers and filter/detector radiometers. Spectroradiometers – with fine resolution over the entire UV range, a “square” response and selectable upper and lower wavelengths – are ideal but can be costly and physically difficult to adapt to UV configurations.
Filter/detector radiometers are the most common type and are more convenient to use. There are several forms: probes, wands, meters with interchangeable detachable sensors and completely portable “pucks.”
All of these instruments are radiometers, as they measure only irradiance, in watts/cm2. A few have internal clocks and can integrate irradiance data over time to report exposure (“dose”) in joules/cm2. A combination of internal components determines the sensitivity and response band of each instrument.
Here’s where things get fuzzy.
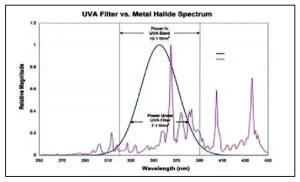
Virtually all f/d radiometers have a “soft” spectral response profile (Figure 2).
Bandwidth, the range from lower to upper wavelength, is a matter of interpretation. Some manufacturers define the wavelength range at the 10% response points, while others more commonly use the 50% points.
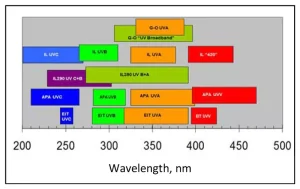
A modest review of several commercial UV radiometers reveals a variation of the named bands among manufacturers and models, illustrated in Figure 3. (For a fair comparison, all bands were normalized to the 50% points.)
So, in UV technology, we not only don’t have a “standard” wavelength reference as we do in lighting technology, but the reference varies with the radiometer chosen.
Knowing a radiometer’s response band is important. Reporting radiometer data without the band data (or identification of manufacturer and model) would lead to differences in data or reproducibility – except when comparisons are made with the same or same type of radiometer.
It’s difficult to understand why – in reports, articles and even in technical papers – measured wavelength bands often are not reported with data.
This may be surprisingly common in UV technology, but that’s what we do.
Contact: R.W. Stowe, d.stowe@heraeus.com