

Olivier Autin
lead research scientist, Typhon Treatment Systems
James R. Bolton
president, Bolton Photosciences
Light-emitting diodes (LEDs) have attracted a great deal of attention in the UV world. The advantages of UV LEDs over traditional mercury lamps are now well established. However, until recently, their low output power has limited them to small-scale, point-of-use applications.
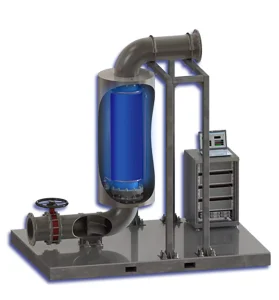
Typhon Treatment Systems was founded in 2014 with the sole purpose of developing UV LED technologies to treat higher, continuous flow rates of water to suit municipal and industrial scale applications. At the time many felt this was too early, but the rapid development of UV LEDs over the last four years has enabled Typhon to validate its first system, the BIO-310, in July 2018. This article presents the results of the validation of the BIO-310 LED UV reactor (Figure 1).
The reactor was validated according to the US Environmental Protection Agency Ultraviolet Disinfection Guidance Manual (UVDGM 2006) with some adaptations from the more recent paper “Innovative Approaches for Validation of Ultraviolet Disinfection Reactors for Drinking Water Systems” (Wright 2018).
The reactor
The reactor design was optimized using optical modeling to maximize the light transmission into the flow cell.
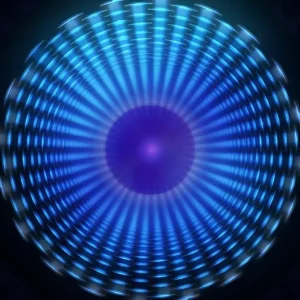
The reactor is composed of a Ø300 mm x 1.2 m-long quartz tube surrounded by an array of 1,000 lighting units, each comprising an LED light source and reflector that directs the light to an optimized focal point, resulting in a near uniform irradiance through the full cross-section of the reactor (Figure 2).
Twenty lighting units form a ring around the perimeter, with 50 rings along the length of the reactor delivering an even UV dose distribution. LG Innotek UV-C LEDs emitting a peak wavelength at 275 nm and an optical power of 100 mW at 350 mA were used for the validation. Although the wall plug efficiency of UV-C LEDs is still low in comparison to conventional LP mercury lamp systems, the much higher reactor efficiency compensates to improve the overall efficiency of the system. The choice of supplier was based on selecting LEDs with the highest output power available at the time of validation.
The methodology
The UVDGM validation method was followed, using the calculated UV dose approach. The validation testing was conducted at Cumwhinton Water Treatment Works in the north of England, with the challenge water taken after conventional filtration (i.e., coagulation/clarification/rapid gravity filtration). The water had a UV-T 254 of around 97% and was not chlorinated.
SuperHume was used as the UV absorber in order to adjust the UV-T of the water, and MS2 was used as the challenge microorganism. Twenty-seven conditions were tested, consisting of permutations of the following conditions:
- Flow rate: 80, 125 and 250 m3/h
- UV-T: 90%, 95% and 98% UV-T (at 275 nm)
- Output power: 34%, 74% and 100% of the full output power
Calculated UV dose approach
The US EPA Long-term Two Enhanced Surface Water Treatment Regulations (LT2ESWTR 2006) focuses on the treatment of Cryptosporidium, Giardia and viruses.
In the case of UV disinfection, minimum UV doses are specified for various log removal factors. For drinking water, often Cryptosporidium is the most important target for which the required UV doses are given in Table 1.
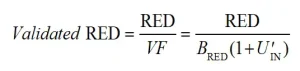
The 2006 UVDGM states that the experimental reduction equivalent dose (RED) is given by:
RED = Validated UV dose × VF (1)
where VF is the validation factor given by:
VF = BRED × Bpoly × (1 + Uval) (2)
where BRED is the RED bias factor;
Bpoly is the polychromatic bias factor; and
Uval is the uncertainty of validation expressed as a percentage of the RED.
For monochromatic light sources (e.g., the 275 nm UV LED), Bpoly is 1.0. Uval can be expanded as:
Uval = (UIN2 + UDR2 + US2)0.5 (3)
where UIN = uncertainty of interpolation;
UDR = uncertainty of the UV dose – response; and
US = uncertainty of the UV sensors.
According to the UVDGM, if US <10% and UDR < 30%, they can be set to zero, as was the case in the study, so Uval = UIN.
Master equation
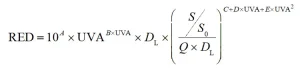
The calculated UV dose approach in the UVDGM involves determining the RED for a series of test conditions using a challenge microorganism (MS2 was used in this study) and then fitting to a master equation. For this study, a master equation derived from one in the “Innovative Approaches” paper (Wright 2018) was selected, as it appeared to best fit the data:
 (4)
(4)
where UVA is the absorption coefficient (cm–1) of the water at 275 nm;
DL is the UV dose per log of the test microorganism (MS2);
S/S0 is the sensor factor, where S is the sensor reading and S0 is the sensor reading at full power;
Q is the flow rate (m3/h); and
A, B, C, D and E are the fit parameters.
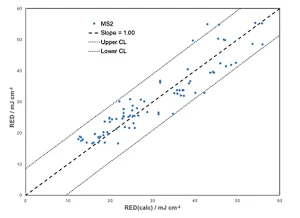
The experimental RED data must be fit to equation 4 with the fitting constants determined by a nonlinear regression analysis using the solver function in Excel.
Restrictions must be applied so that C + D×UVA + E×UVA2 ≤ 1.0 and its derivative (D + 2*E×UVA) ≤ 0. A linear regression of RED vs. RED(calc), forced through zero, should have a slope within 2% of 1.00 and an R2 > 0.95.
It was found that, among all conditions, the relative error (∆RED/RED) is random and not a function of RED, so it is assumed that the quantity
U´IN = t × SD´ (5)
adequately represents the uncertainty, where SD´ is the standard deviation of the relative differences between measured and predicted REDs as determined from the RED vs. RED(calc) correlation, and t is the factor (t = 2.05) that determines the 95% confidence level. Then
 (6)
(6)
REDs from the UV dose–response curve
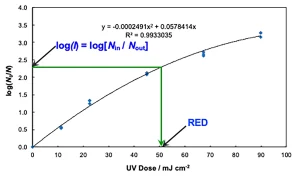
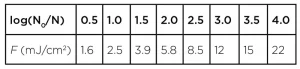
For each of the 27 test conditions, four influent and four effluent samples were taken – timed so that a given effluent sample was taken from the same water as that for a given influent sample. The test conditions were organized into three sets – one for each UV-T. For each set, water was taken loaded with MS2 (but untreated by UV) for the purpose of carrying out a UV dose-response analysis (see Figure 3 for an example). These data then were fit to a quadratic equation as shown in Figure 3.
The UVDGM – and the “Innovative Approaches” paper – recommends plotting UV dose vs. log inactivation (N0/N) to allow conversion of the effluent/influent data to RED. However, this approach is believed to be flawed because, in regression analysis, it is assumed that all the error is in the independent variable – which is not the case for the recommended procedure. Instead, the UV dose-response fit equation was used to generate a large set of log(N0/N) vs. UV dose values. A LOOKUP function then was used to select an appropriate RED for each log(N0/N) from the effluent/influent set of data.
RED data analysis
The experimental REDs were then fitted to the master equation (Equation 4). The resulting fit is shown in Figure 4. From the limits at the 95% level, the uncertainty factor UIN is determined as 0.294.
RED bias factor
Table 2 is obtained from Appendix G of the UVDGM.
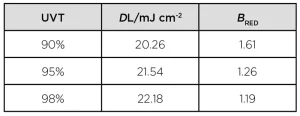
These BRED values are a linear function of the UV-T:
BRED = -0.05224×UV-T+6.3151 = 6.3151–5.224×10–UV-A (7)
Hence, the validation factor is:
VF = (6.3151 – 5.224 × 10–UV-A)(1 + UIN) (8)
On insertion into equation 4, one obtains the equation for the validated RED:
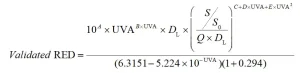 (9)
(9)
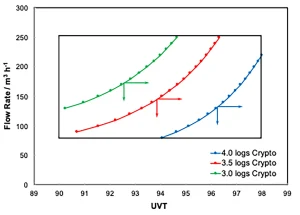
This equation was solved for several pairs of Q and UV-T and for 3.0, 3.5 and 4.0-logs inactivation of Cryptosporidium. The results are given in Figure 5. The arrows indicate the ranges of UV-T and Q for which the UV reactor is certified to deliver 3.0, 3.5 and 4.0-logs Cryptosporidium inactivation.
This work represents what is believed to be the first third-party validation of an LED UV system using the UVDGM guidelines. The BIO-310 reactor was validated for 2 to 4-log Cryptosporidium inactivation for flow rates up to 250 m3 h-1 and UV-T in the range 90 to 98%.
The primary objective of this work was to validate the reactor against specific design criteria: a maximum flow rate of 250 m3 h-1, a minimum UV-T of 95% and a target of 3-log Cryptosporidium inactivation, which was successfully achieved (Figure 5).
However, it is fair to say that a few experimental issues caused a negative impact on the RED bias factor and the uncertainty of validation. Correcting these issues would have a significant positive impact on the validated performance.
Additionally, in the year since the validation testing took place, the output power of commercially available UV-C LEDs has more than doubled.
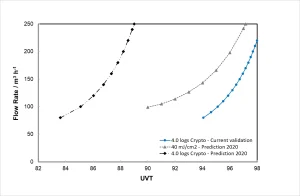
herefore, the next challenge is to revalidate the system with the more powerful UV-C LEDs and refined experimental procedures enabling an extension of the validated range of operation to lower UV-Ts and higher flow rates, thus increasing the system’s potential as a viable Cryptosporidium barrier and opening up opportunities as a primary disinfection barrier as shown in Figure 6.
While many skeptics still see large-scale UV LED water treatment as not being competitive against conventional mercury lamp systems, some technology is believed to be capable of competing for specific applications on a whole life cost basis.
Today, initial capital costs tend to be slightly higher for LED UV technologies (arising from low wall plug efficiencies (WPE) and comparatively high $/mW costs), but it is well accepted that the WPE will keep increasing – leading to lower energy costs and longer lifetimes at every end-of-life of the previous set – whilst the cost per UV LED is expected to decrease significantly.
In addition, since UV LEDs are solid-state devices, driven by current with an unlimited turndown potential, UV dose monitoring becomes a powerful tool.
Being able to adjust S/S0 (in the dose monitoring equation) in real time (every 100 ms) when a change in operational conditions is observed (i.e., flow rate or UV-T) enables one to maintain the required UV dose while minimizing the energy consumption. This feature on its own can reduce energy consumption by more than 40%.
However, while the US EPA allows the validation of UV LED systems based on existing guidelines (UVDGM and “Innovative Approaches for Validation of Ultraviolet Disinfection Reactors for Drinking Water Systems”), it has been suggested that new – specific to UV LEDs – documentations would be required for UV LED systems to comply with European standards (DVGW, ÖNORM), a process that could take years to put in place.
Until recently it has been believed that the use of UV-C LEDs for municipal water treatment was still a few years away, but its time is coming fast.
In order to allow this market to develop, encourage new entrants and for end users to take advantage of such innovative solutions, it is vital that existing standards are updated/amended to embrace the new technology.
Contact: Olivier Autin, oautin@typhontreatment.com; James R. Bolton, jbolton@boltonuv.com
References
LT2ESWTR 2006 Long-term 2 Enhanced Surface Water Treatment Regulations https://www.epa.gov/dwreginfo/long-term-2-enhanced-surface-water-treatment-rule-documents US Environmental Protection Agency, Washington, DC.
UVDGM 2006 Ultraviolet Disinfection Guidance Manual https://nepis.epa.gov/Exe/ZyPDF.cgi?Dockey=600006T3.txt US Environmental Protection Agency, Washington, DC.
Wright, Harold 2018, Innovative Approaches to UV Validation with Appendixes Nov 2018 Draft Final, private communication.