

By Dylan Gleason, Vladimir Popović and Tatiana Koutchma, Agriculture and Agri-Food Canada, Guelph Research and Development Center
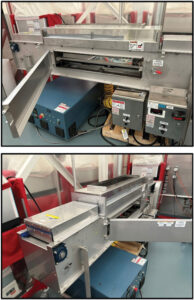
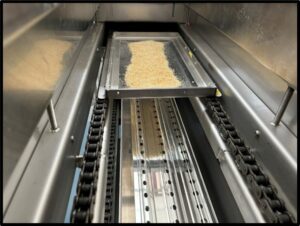
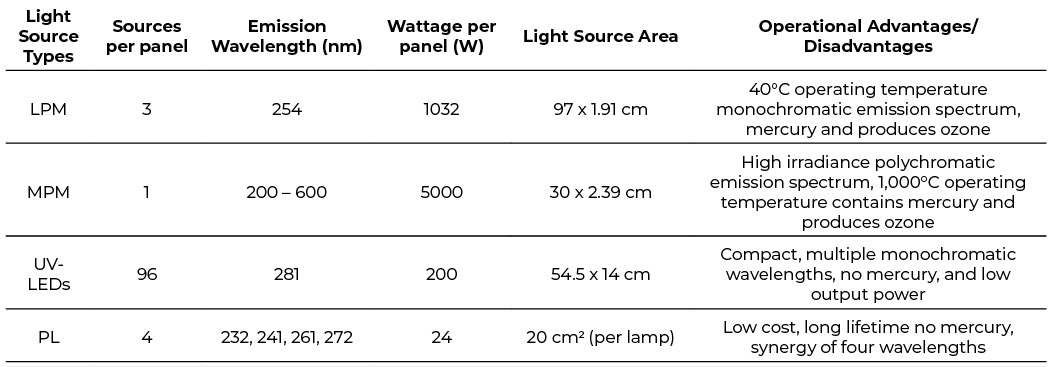
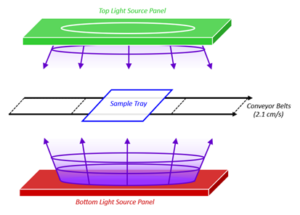
A custom-built ultraviolet (UV) light conveyor system was developed for the treatment of solid food samples in pilot scale (Figures 1 and 2) (Ag Growth International Inc.; Georgetown, PE). The system was designed to support four sets of interchangeable panels with mounted UV lights that are available commercially or under development: low-pressure mercury (LPM) lamps, medium-pressure mercury (MPM) lamps, UV LEDs and a novel phosphor pulsed light (PL) lamp. Technical parameters of the UV sources are summarized in Table 1. Samples were placed on a UV-permeable Teflon sample tray, which could be moved through UV chamber at an adjustable speed (0.3 cm/s – 2.1 cm/s) between a set of lower and upper UV lamps, which produced 3D light exposure (Figure 3).
In order to fully characterize the UV fluence delivery at different wavelengths inside the conveyor and on the tray surface, various measurement devices and approaches were used. This was critical for accurately determining the relative efficacy and uniformity of the UV light sources and treatment conditions. The purpose of this article is to 1) outline the methodology used for characterizing UV light conveyor systems with various light sources; 2) compare the accuracy of common UV light measurement devices, including a radiometer with two different UV-C detectors, a spectrometer and two wireless pucks; and 3) evaluate fluence distribution on the tray surface.
UV Measurement Devices and Methods
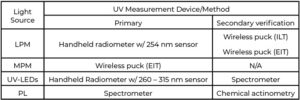
Due to different emission wavelengths and operating temperatures of the various UV sources, multiple UV measurement instruments and sensors were used. The devices and methods used for each UV source are summarized in Table 2. The instruments used for these measurements were as follows:
- Handheld radiometer (ILT2500; International Light Technologies Inc., Peabody, MA, USA) connected to a germicidal sensor either calibrated to 254 nm (ILT; XRD140T254) or to 260 – 315 nm (SED270; ILT Inc.)
- Spectrometer (USB2000+; Ocean Optics, FL, USA) calibrated between 200 – 900 nm
- Wireless puck measuring at 254 nm (ILT800 CureRight Radiometer; ILT Inc., MA, USA)
- Wireless puck measuring in the UV-C, UV-B, UV-A and Visible ranges (Power Puck II; EIT 2.0 LLC, VA, USA)
In addition, where real-time fluence measurements could not be performed using the noted instruments, chemical actinometry was used. This method previously was described by Biancaniello et al. (2018). 1 In short, a standard curve correlating fluence and absorbance of a methylene blue (MB) actinometer at 663 nm first was constructed using the same light source in bench-scale. Next, MB was treated inside the UV conveyor, and the resulting change in absorbance was used to determine the fluence per pass.
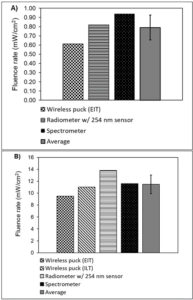
The UV light measurement devices were first cross referenced for accuracy by measuring fluence rate of two stationary LPM lamps emitting at 254 nm (Figure 4). The authors observed readings with an error range between 14% and 18%. Although this generally was within an acceptable range, it showed that UV measurement devices do not respond to light sources equally despite being calibrated. This likely is influenced by a number of factors, including fluence rate detection range, temperature, etc. Therefore, users routinely should cross reference as many UV light measurement device as possible in order to confirm accuracy and to select the most appropriate device. The robustness of the devices also should be considered. For example, some devices cannot withstand the high operating temperatures that can be generated by MPM lamps or Xenon PL lamps.
Characterization of the UV Conveyor
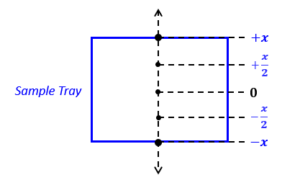
Characterization of the UV sources was critical for accurate evaluation of fluence per pass on samples being treated inside the conveyor. This procedure included testing spatial uniformity of the fluence rate (irradiance) and fluence (dose) on the sample tray as it moved through the conveyor. The uniformity inside UV conveyor typically varies due to a number of factors, including lamp positioning and unequal light output among lamps. The authors observed variation in both fluence and fluence rate measurements, depending on where the sample was located along the tray. This meant that delivered fluence per pass through the conveyor was not equal for samples placed on the edges of the tray vs. ones in the center of the tray. For this reason, the authors determined fluence per pass by performing real-time measurements at multiple points along the width of the tray, which gave an averaged, cumulative and more accurate fluence value (Figure 5). Real-time fluence measurements were performed using either wireless pucks or with a radiometer and a corded sensor, which could be fed through the conveyor. In both cases, a real-time integrated fluence measurement was obtained. All reported fluence rate and fluence measurements on the surface of the treatment tray were averaged between the upper and lower lamps. Upper-lamp measurements were obtained by placing the sensor face-up on the tray surface while lower-lamp measurements were obtained with the sensor face-down on the tray surface.
LPM Lamps
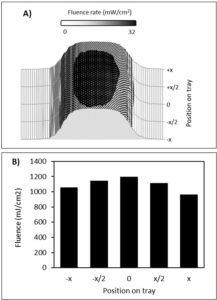
A wide range of UV measurement devices and options are available for the LPM due to its widespread use in commercial and research settings. The LPM lamp panels used in the UV conveyor unit consisted of three lamps per panel. The authors used the handheld radiometer (ILT2500) with the germicidal sensor calibrated at 254 nm to characterize both the fluence rate and the fluence on the surface of the treatment tray at a conveyor speed of 2.1 cm/s. Figure 6a shows a 3D plot of fluence rate, which was generated by real-time measurements at five points along the width of the treatment tray as it moved through the entire length of the conveyor. The peak fluence rate was shown to be in the center or the treatment tray and at the center of the conveyor (33 mW/cm2). Fluence rate decreased by up to 20% at the edges of the tray, as well as showing a minor ramp-up and ramp-down period as samples entered and exited the interior of the conveyor. Similarly, fluence per pass was measured in real time at five points along the width of the sample tray and shown in Figure 6b. The average fluence per pass between the upper and lower lamps, as well as the various tray positions, was 1152.7 mJ/cm2. This value was verified with the two wireless pucks, and a standard error of 18% was observed among the three UV light measurement devices. The wireless pucks generated slightly lower fluence values compared with the radiometer/sensor.
MPM Lamps
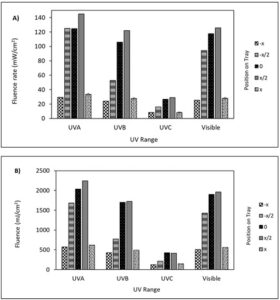
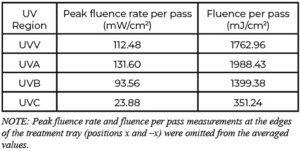
MPM lamps are a polychromatic light source that emit at much higher fluence rates compared to LPM lamps. However, this comes at the cost of high operating temperatures (1000°C). The MPM lamps were mounted in a staggered orientation on the panel and operated at 50% power output to limit heating of samples. An air blower in the treatment conveyer also was used to limit the internal temperature in the chamber. The high fluence rate and operating temperature of the MPM lamps prevented the use of multiple UV light measurement devices. For example, a spectrometer could not be used because of signal saturation and high temperature. Therefore, only the EIT wireless puck was used for measurement of fluence rates and fluence per pass values, and these were reported at five positions along the width of the treatment tray at a conveyor speed of 2.1 cm/s. This device generated separate values for the UV-C, UV-B, UV-A and visible range and could not be used for real-time fluence rate measurements. Hence, only peak fluence rates were reported on the surface of the tray (Figure 7a). Fluence values per pass are shown in Figure 7b. The authors observed a large drop in peak fluence rate and fluence per pass values at the edges of the treatment tray. For this reason, samples were not placed on the edges of the tray and values corresponding to these areas were excluded from reported averages (Table 3). The MPM lamp emitted only 6.4% of total fluence per pass in the UV-C range, with the rest being emitted in the UV-B, UV-A and visible ranges.
UV LEDs
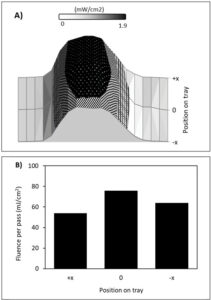
Two UV LED panels (Lind Canada; Markham, ON) containing 96 individual LEDs emitting at 281 nm were used per panel. UV LEDs typically produce much lower fluence rates compared to traditional mercury-vapor lamps and operate at ambient temperatures. In this study, real-time measurement of fluence rates and fluence per pass was carried out using a handheld radiometer with a SED270 sensor and a QT diffuser at a reduced conveyor speed of 1.08 cm/s. Fluence rate values were verified for accuracy using a spectrometer. Figure 8 shows a 3D plot of average fluence rates (upper and lower panels) measured at three points along the width of the treatment tray as it moved through the entire length of the conveyor. Peak fluence rates were observed in the middle of the conveyor (1.85 mW/cm2), with a minor drop-off at the edges of the treatment tray. Fluence per pass values also were determined at three points along the width of the treatment tray. The average fluence per pass when all three positions are considered was 62.9 mJ/cm2.
Phosphor PL Lamp
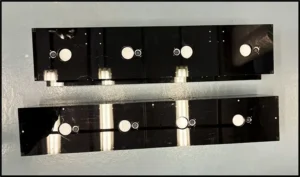
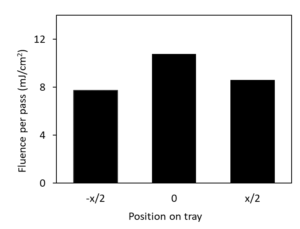
The PL lamp used in the UV conveyor system was a novel phosphor UV source emitting polychromatic light in the UV-C range at four distinct peaks, as shown in Table 1, with a frequency of 1.2 kHz and a pulse width of 100 ms (eUV; Deep Light Photonics; CA, USA). Upper and lower panels were each comprised of four lamps (Figure 9). Due to the polychromatic and pulsing nature of this light source, the authors could only measure fluence rate at stationary points on the tray surface using a spectrometer rather than real-time measurement. Peak fluence rates were observed directly above and below the four lamps, with a complete drop-off in between the lamps. Also, none of the previously mentioned UV measurement devices were capable of performing real-time fluence per pass measurements. For this reason, the authors performed real-time fluence measurement using chemical actinometry at three points along the width of the treatment tray and at a conveyor speed of 0.55 cm/s (Figure 10). An average fluence per pass when all three positions are considered was 8.3 mJ/cm2. Studies with this novel PL lamp currently still are in progress.
Conclusion
This study outlined the approach for characterizing light output and uniformity in a custom UV conveyor with multiple UV sources emitting at multiple wavelengths. The authors highlight the importance of using as many UV fluence measurement devices and approaches as possible in order to confirm accurate results depending on the UV source being used. Further, due to the often nonuniform nature of light exposure inside UV conveyors, it was shown that real-time and integrated measurements of fluence were necessary to accurately determine fluence per pass.
The variety of outputs allows the conveyor to be versatile and optimize UV treatment depending on the sample used, whether it is ground or whole grain, berries, meat or other products that require to deliver designed fluence at a specific wavelength and achieve the processing objective. The UV process can be optimized by selecting a UV source that can be fitted to the conveyer. The highest fluence of MPM lamps is effective but comes with many operational disadvantages. Other new technologies, like UV LEDs and PL, have lower fluence but are promising in terms of operation, power efficiency advantages and wavelengths. As work on this UV conveyer currently is in progress, the authors are open to suggestions, comments and concerns about the project.
Reference
- Biancaniello, M., Popović, V., Fernandez-Avila, C., Ros-Polski, V., & Koutchma, T. (2018). Feasibility of a Novel Industrial-Scale Treatment of Green Cold-Pressed Juices by UV-C Light Exposure. Beverages, 4(2). doi:https://doi.org/10.3390/beverages4020029
Tatiana Koutchma, Agriculture and Agri-Food Canada, Guelph Research and Development Center, can be reached via email at tatiana.koutchma@agr.gc.ca.