

By Greg McKee, Chief Technologist / Product Marketing Manager, Labsphere, Inc.
During the height of the coronavirus pandemic, governmental guidance was provided to reduce false claims and improve confidence in the effectiveness of UV disinfection devices and sources. The US FDA classifies general hospital and personal use devices as Class II UV radiation chamber disinfection devices. When the chamber includes a UV lamp, the FDA recommends that the manufacturer evaluate whether the product controls for time, UV radiation dose and the intensity of UV dose, and validates the cleaning and disinfection procedures.1 However, the application of UV disinfection of air and surface extends well beyond devices, including tunnels, rooms, elevators and other open-air or confined spaces where UV light is used to kill pathogens and other kinds of microorganisms. Ideally, the manufacturer provides the end user with a way to know, at any time, the effectiveness of the disinfection devices or UV sources in the given application. This requires UV-C irradiance sensors with appropriate form factor, functionality and, more importantly, the ability to provide real-time irradiance and dose values with a high level of confidence.
However, many available devices and environments currently do not monitor whether exposure and dose levels consistently are met for pathogen deactivation. Evidence suggests that many of the commercially available UV-C irradiance sensors (herein referred to as sensors) used to monitor or characterize irradiance and dose often show poor and varied results, leading to high uncertainties in the effectiveness of ultraviolet germicidal irradiation (UVGI) devices and a poor understanding of the irradiance reaching the target area of surface disinfection. The variances in sensor performance presented at the ICUDAS 2020 conference immediately identified a problem in the industry.
The authoring company researched the technical and application issues with UV disinfection and developed a series of UV-C and Far UV-C irradiance sensors to address this industry’s performance challenges. Many of the issues encountered are due to the fundamental characteristics of irradiance sensors, specifically the directional response and the calibration for the application.
Irradiance sensor cosine response performance
Irradiance sensor fundamentals
Irradiance is the radiant flux falling onto a surface (power/area). The light may come from any direction and from single or multiple sources. The total radiation falling onto the surface, regardless of the direction it comes from, must be measured. This is called the cosine law. A measurement device that obeys the cosine law is called a near cosine collector. Good cosine response of the sensor is essential when measuring the irradiance of almost any source. Illustrated in Figure 1 is the projected acceptance area of a flat receiving surface and how it varies with the cosine of the angle.
Therefore, the sensor needs to accurately capture the incident irradiance that is dependent on directionality. The evaluation of the incident radiation as a function of the angle of incidence is determined by the shape and the optical properties of the sensor acceptance area, as well as by the geometric and optical construction of the radiometer head.
Research was conducted into root causes for large variances reported by users of commercially available UV-C irradiance sensors. The directional response was identified as a high contributing factor to the sensor’s response in common surface-disinfection measurement applications.
f2 explained
The metric f2 is an index describing the deviation from the ideal cosine response of the radiometer head to sensor incident at angles other than normal to the reference plane of the head.2 The smaller a sensor’s f2, the closer the sensor’s response is to an ideal cosine collector. The sensitivity performance to angular incident irradiance is critical for the applications where the irradiance sensors are used in the near-field measurements of single and multiple extended sources, such as enclosures, chambers and room disinfection environments. Based on this research and the authoring company’s expertise in light measurement solutions, a line of UV-C irradiance sensor solutions has been developed. For optimizing the performance of these UV-C irradiance sensors, the following factors were considered (but not limited to): optical diffuser materials, diffuser materials geometry, photodiode to diffuser geometric relations, surface geometry, sensor signal and the measurement reference plane.
Directional sensitivity measurements
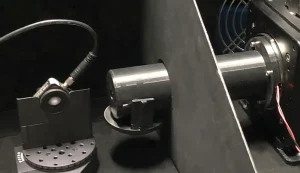
For the measurement of directional response, a test jig comprising an optical rail with a goniometer stage for mounting the sensors and a TEC controller for the UV-C source was developed, as shown in Figure 2. Measurements of the signals as a function of the angle of incidence were done in two perpendicular planes and recorded from -80° to +80° in 5° increments. Precautions were taken to exclude stray radiation incident on the acceptance area of the radiometer head.
Results
Sensor cosine responses
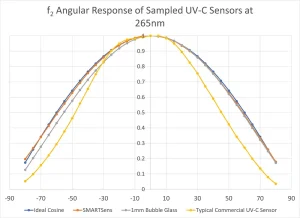
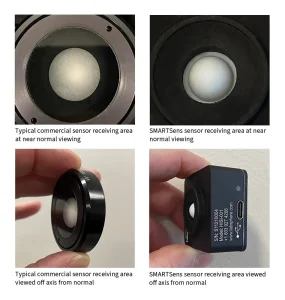
Distribution response data collection performed on the sensor with the authoring company’s diffuser dome was compared to the same sensor geometry with a bubble glass diffuser and a common commercially available UV-C sensor. Figure 3 compares the authoring company’s sensor to the commercial sensors at the near-normal viewing acceptance area off-axis. Figure 4 illustrates the normalized directional response for each device.
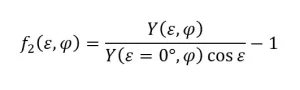
The collection of measured data is used to compute f2 for each sensor tested. The deviation of a UV-C irradiance is shown in Equation 1.
 Equation 1.
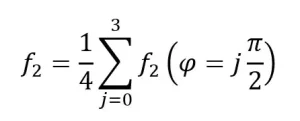
For characterizing the directional response, f2(ε,φ) is measured in orthogonal planes of azimuth ![]() and the directional response index, f2, is calculated as shown in Equation 2.
and the directional response index, f2, is calculated as shown in Equation 2.
 Equation 2.
Where Equation 3 is calculated:
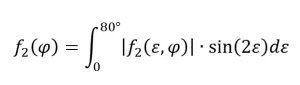 Equation 3.
The f2 results for each sensor are presented in Table 1.
What does it mean to users?
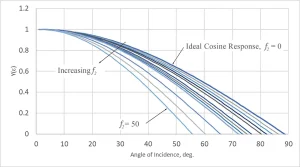
The irradiance distribution from an ideal line source of length L, and power, P, was modeled using the Keitz equation3 to investigate the performance of irradiance sensors with varying f2 values. Sensor f2 values were calculated by stretching the ideal cosine response over ±80° as shown in Figure 5 for the theoretical sensor output, Y(ε) vs. incidence angle, ε.
The geometry is shown in Figure 6 for the
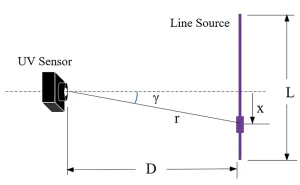
sensor and an ideal line source, with Equation 4 describing the irradiance at the sensor due to each source element, dx, along the source. During the numerical integration, the irradiance for each element was multiplied by its associated directional response, Y(ε) to account for the change in sensor response due to the angle of incidence, ε, from the source element. This final irradiance then was compared to the calculated irradiance from an ideal cosine receiver to
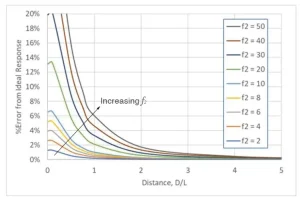
determine the error due to the sensor directional response, f2. This method was repeated over a range of source distances, D, to evaluate the effect of sensor response on the error in the measured irradiance shown in Figure 7.
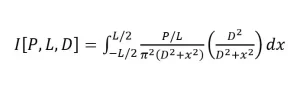 Equation 4.
The analysis assumes an ideal source with a Lambertian distribution. While real sources typically try to emulate this distribution, they seldom are Lambertian in the nearfield (D/L<10), and the error in measured irradiance will be greater than what is predicted in these ideal models. For sources that are designed to produce specific spatial irradiance distributions, application of the distribution to the sensor response is required to assess the accuracy of the sensor. The deviation of the source distribution from an ideal Lambertian source will amplify the error from the sensor measurement as the f2 index increases.
Conclusion
The UVGI industry is challenged by inconsistent irradiance and dose measurement from commercially available UV-C sensors. This has led to uncertainty in UV-C surface disinfection for pathogen reduction and deactivation. A primary contributing factor to measurement errors of UV-C sensors is the directional response sensitivity to the proximity of sources of irradiation in applications like chambers and upper air monitoring, where the sensors may be located close to one or more UV light sources irradiated from multiple directions. An f2 value of less than 2.0 % is achievable with proper consideration of the factors contributing to sensor sensitivity error. Higher values of f2 can quickly ramp up to a primary contributor to measurement uncertainty in surface disinfection application environments.
Buyers of commercial sensors should consider reported directional response index values with their purchase decision as a differentiator of performance. Improvements over typical UV-C sensor designs are discussed here, providing more effective purpose-built solutions for UV-C detection and dosage monitoring, which can lead to more reliable virus and bacterial disinfection validation and safer environments.
References
- Enforcement Policy for Sterilizers, Disinfectant Devices, and Air Purifiers During the Coronavirus Disease 2019 (COVID-19) Public Health Emergency Guidance for Industry and Food and Drug Administration Staff
- CIE 220:2016, Technical Report, Characterization and Calibration Methods of UV Radiometers
- Michael Sasges, Jim Robinson & Farnaz Daynouri (2012) Ultraviolet Lamp Output Measurement: A Concise Derivation of the Keitz Equation, Ozone: Science & Engineering, 34:4, 306-309, DOI: 10.1080/01919512.2012.694322