

Tonnie Telgenhof Oude Koehorst, product manager/new business UV, Nedap
Ultraviolet low- and medium-pressure lamps and LEDs are well known and widely accepted UV sources for disinfection applications for air, surface, water and other fluids. Improving efficiency of UV lamps has reached physical limits, and UV LEDs still have a long way to go. Unfortunately, the overall efficiency of the energy supply systems for the UV sources are, in most cases, not getting the right amount of attention, and short-term costs for initial investment are prevailing over the total cost of ownership.
Most ballasts/lamp drivers act as non-linear loads on power grids, drawing a distorted waveform that contains harmonics and results in electromagnetic compatibility (EMC) problems, including power quality issues. When electronic lamp drivers consume power in a pulsed manner, it leads to a lower power factor. Remember that the conventional power grid was designed for linear loads.
Repeating peak currents at the mains input will contain harmonics, and the summation of all harmonics is known as total harmonic distortion (THD) of the current and mains voltage, depending on the power line impedance. The impacts of lower power factor and harmonic current and voltage distortion are increased losses in transformers, power lines and overheating and degradation of conductors and insulating material. Finally, it could reduce lifetime of components.
Another power quality problem to UV systems can be mains surges, transient peak voltages (several kilovolts) at the input of the ballast/lamp driver. With insufficient surge suppression in the ballast, these transients can lead to damage of the driver and will reach the lamp, possibly leading to premature lamp failures. The impact of power factor and THD of electronic lamp drivers was investigated by benchmarking four topologies available in the market. A comparison was made regarding overall efficiency and power quality, costs and CO2 footprint impact.
Power factor and harmonics
The ratio of real power and apparent defines the power factor in an AC electrical power system and is caused by the voltage and current being out of phase. A lower power factor (optimum = 1) causes higher currents in the power grid and causes additional copper losses (I2*R). Additionally, distortion of the input voltage and current caused by a device like an electronic lamp driver/ballast will lead to additional harmonic currents. In this case the copper losses (I2*R) will increase due to higher currents (I) and due to the skin effect, where higher frequency currents flow primarily in the outer layer of a conductor, causing an increase in resistance (R). Also, Eddy Current will add some additional losses, as stray electromagnetic fields induce circulating currents in wires and windings of transformers.
The increase in total current (Irms) due to the harmonics can be calculated by multiplying the basic current I1 (at line frequency 50 Hz or 60 Hz) by a factor determined by the THD(i)
Irms = I1 * √ (1+THD2)
This is shown in the following graph:
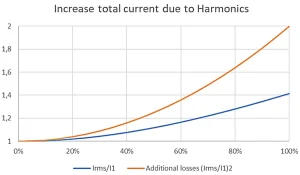
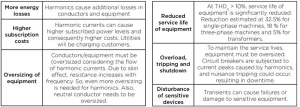
Devices that cause severe THD(i) levels of 60% will show an increase of total current of 16%, leading to additional power losses of 36%. This is excluding the additional losses because of the skin effect (Table 1).
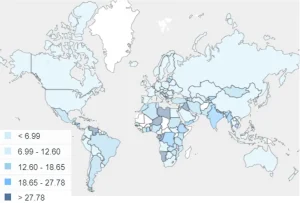
In the quest for more reliable and more energy-efficient systems it is also important to investigate the losses in the power grids, heating up power cables and transformers.
Minimizing these losses will reduce overall costs and will reduce the CO2 footprint. On average, the power line losses are around 8% but are heavily dependent on country (Figure 2).
Benchmark electronic lamp drivers
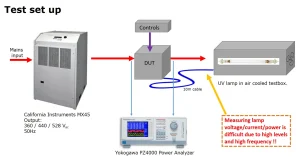
To investigate the performance on power quality, four topologies available in the market were evaluated. As there is a wide range of applicable power levels and type of lamps, four drivers for medium-pressure lamps were tested, and results were normalized to 100% power level. All units were tested with lamps in an air-cooled test chamber and at 21°C ambient temperature. Figure 3 shows the set-up used.
Besides the Nedap drivers (“D”), three other topologies were tested, two European designs (“A1+A2” and “B”) and one Asian design (“C”). Design B is made available to the market by several brands.
Efficiency
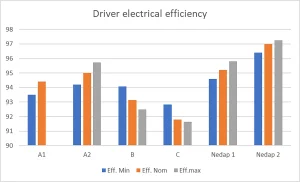
Driver efficiency was measured with the Yokogawa PZ4000 Power analyzer and at minimum, nominal and maximal specified input voltage and at 100% power (Figure 4).
It should be noted that in some cases (A + B) additional power to cooling fans is not included. In cases C and D, the power for the cooling fans for the drivers are included. With state-of-the-art components and designs, an overall efficiency of >95% should be achievable.
Power factor
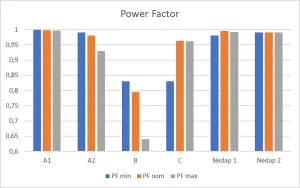
Again, at three input voltage settings the power factor was measured (Figure 5).
As indicated the target here is to be close to PF=1. In several cases a good power factor of well above 0.98 was noticed. In one case (B) a very poor power factor (<0.65) was measured at 100% output power and maximal input voltage.
Designs A+B showed instability depending on impedance of the power line. In these cases, extra attention is needed for extra power line filters to protect the driver for overvoltage, functional instability and to improve the EMC levels produced by the driver.
Design A also showed a weak point at input line under voltage. The output power of the driver in these cases was not dimmed, causing the input current reaching the input fuse rating. This could lead to overheating of components and/or nuisance failures in the field.
During powering of design C, a current peak of 185A at Vin=460V was measured. Nominal value of the input current at 100% output power is around 34A.
Total harmonic distortion
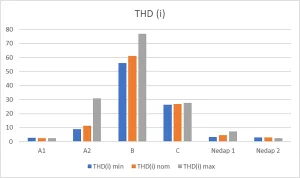
Finally, values for the THD(i) were determined (Figure 6).
The target here is to be below 10%. Both Nedap and design A1 show excellent performance here. Design B shows a very high level even at nominal input voltage of THD(i)=61% and leads to 37% increase in power losses in the power grid.
Skin effect
As a trend to higher power, low-pressure UV lamps is seen, where currents can go up to almost 10A at frequencies of up to 60kHz, the skin effect needs to be taken into consideration when designing the lamp cables, especially in some applications where long distances (>50 m) are required.
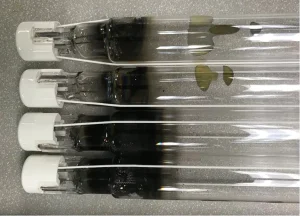
Connectors and terminals also need this attention. In Figure 7 failed lamps are shown after only 300 hours of operation with 60 to 70 on/off cycles.
This premature lamp failure was caused by wrong ferrules and crimping tool, which created excessive additional resistance. This led to too low filament temperatures and excessive wear of the electrodes.
Conclusion
Energizing UV sources can be done more energy efficiently. This will save costs over the lifetime of the product, reduce the CO2 footprint and improve reliability. Initial low-cost systems with limited features regarding power factor, THD, EMC and efficiency will lead to higher operational cost during the lifetime of the systems.
Looking at total costs of ownership will help in making the right decision for electronic lamp drivers.
Special thanks to Gerhard van Eerden and Patrick Boink, Nedap; Bill Sotirakos, Carollo Engineers Inc.; Prof. Leferink-UT Enschede
Contact: tonnie.telgenhof@nedap.com