

Harold Wright
chief technologist-UV disinfection, Carollo Engineers
The Grade A Pasteurized Milk Ordinance (PMO), published by the Food and Drug Administration (FDA), provides standards and requirements for Grade A milk production and processing. The standards are recommended by the National Conference on Interstate Milk Shipments (NCIMS), whose members include state and local regulatory agencies and representatives from the industry. The PMO is revised every two years, with the latest revision in 2017.
The 2017 revision provides a list of criteria required for water treated with UV light to be considered equivalent to pasteurized water. Those criteria include the following requirements:
- UV light shall be applied so that the entire volume of water receives at least the following dose when used as pasteurized water.
- Low-pressure UV at 2,537 Angstrom (254 nm) at 186,000 microwatt-seconds per square centimeter or a 4-log adenovirus equivalent.
- Medium-pressure UV at 120,000 microwatt-seconds per square centimeter or a 4-log adenovirus equivalent.
The UV dose of 186 mJ/cm2 specified for LPHO UV systems is the validated UV dose required by the US EPA’s Long Term 2 Enhanced Surface Water Treatment Rule (LT2ESWTR) for 4-log adenovirus inactivation. The basis for the UV dose of 120 mJ/cm2 is not defined by the PMO. It is clearly not a validated dose for adenovirus credit, as defined by the LT2ESWTR and the US EPA’s UV Disinfection Guidance Manual (UVDGM), because such a dose would not provide 4-log adenovirus inactivation credit. Given past work comparing MS2 and adenovirus reduction equivalent doses with full-scale reactors, the 120 mJ/cm2 is likely an MS2 RED measured during UV validation testing.
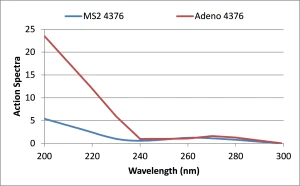
Does an MS2 RED of 120 mJ/cm2 delivered by a MP UV reactor achieve 4-log adenovirus inactivation credit? It is known that RED bias and action spectra (wavelength response) differences (Figure 1) impact the RED measured during validation with two different microbes. If one were to conduct validation of an MP reactor using MS2 phage and adenovirus, the adenovirus Raction-spectra-MS2-phage-and-adenovirusED measured at given flow, UV-T and lamp output would have a greater value than the MS2 RED.
The magnitude of that difference would depend on the UV reactor design and its validation. The width of the dose distribution delivered by the UV reactor, which depends on UV-T and the hydraulics through the reactor, would determine the magnitude of the RED bias affect. The type of quartz sleeve used by the reactor, the UV absorbance spectrum of the water and the relative spacing of MP lamps within the UV reactor would determine the magnitude of the action spectra affect, especially at wavelengths less than 240 nm (Linden et al., 2015).
Because the difference between the MS2 and adenovirus RED depends on the UV reactor design and its validation, one might observe that a given UV reactor delivers an MS2 RED of 60 mJ/cm2 when it delivers an adenovirus RED of 186 mJ/cm2, while another UV reactor delivers an MS2 RED of 150 mJ/cm2 when that reactor delivers an adenovirus RED of 186 mJ/cm2. Clearly, specification of a RED of 120 mJ/cm2 is specific to one reactor technology and its validation.
This is problematic because UV requirements should be independent of any commercial technology and its validation.
It is also known from Water Research Foundation (WRF) Project 4376 that low wavelength benefits realized during validation can go away with the application of the UV reactor in the field because of lamp aging and fouling effects and changing water quality. Lamp aging and fouling both have a greater impact at lower wavelengths. An increase in nitrate will lower UV dose delivery at wavelengths below 240 nm but have negligible impact on UV dose delivery above 240 nm. Commercial UV sensors currently used by many commercial MP systems are not designed to monitor low wavelength UV light. Hence, the low wavelength benefits may not occur with the application, but the UV sensors will not indicate that is the case.
This issue is addressed in the final report of WRF Project 4376 (Linden et al., 2015). This report states that the validation factor for MP systems should include an action spectrum correction factor (ASCF). Appendix C of the report provides tables of ASCFs when MS2 REDs measured during validation are used to show 4-log adenovirus inactivation credit. For a UV system equipped with synthetic quartz, those ASCF values range from 0.89 to 1.79. Appendix D of the report provides tables of ASCFs when adenovirus REDs measured during validation are used to show 4-log adenovirus inactivation credit. For a UV system equipped with synthetic quartz, those ASCF values range from 1.06 to 5.49.
The UVDGM states that the required RED for disinfection credit is calculated as:
Required RED = Required Dose × Validation Factor
where the required dose is specified by the LT2ESWTR.
With inclusion of the ASCF, the validation factor (VF) for MP systems is calculated as:
VF = BRED × BPoly × ASCF × (1 + UVal)
where BRED is the RED bias; BPoly is the polychromatic bias; and Uval is the uncertainty of validation.
Per the UVDGM, if MS2 REDs are used to show adenovirus log inactivation credit, the RED bias is set to 1.0. The polychromatic bias of many MP systems also can be set to 1.0, per the UVDGM. The uncertainty of validation with MS2 is around 3% for an MS2 RED near 186 mJ/cm2. If the ASCF values given in WRF Project 4376 vary from 0.89 to 1.79, then the MS2 REDs for 4 log adenovirus vary from 171 to 343 mJ/cm2, well above an MS2 RED of 120 mJ/cm2. The ratio of these numbers to the value of 120 mJ/cm2 ranges from 1.42 to 2.85.
In other words, an MP UV system operating with a UV disinfection application to deliver an MS2 RED of 120 mJ/cm2 based on validation could, in actual fact, be delivering an adenovirus validated dose ranging from 42 to 85 mJ/cm2 – values that achieve only 0.58 to 1.64 adenovirus log inactivation credit.
The PMO UV dose requirements are impacting the use of UV disinfection systems in other markets. For example, a UV specification in the beverage market calls for a UV dose of 186 mJ/cm2 for low pressure, high output (LPHO) systems but only 120 mJ/cm2 for MP systems. No reference is made to adenovirus; hence, these requirements are being generalized in other markets.
Other comments on the PMO
 The PMO specifies that “There shall be one (1) sensor for each UV lamp.” This requirement prevents the use of LPHO UV systems that would be considered acceptable for potable drinking water applications. This requirement was put in place to address uncertainty with UV dose monitoring that occurs with LPHO systems that use one UV sensor to monitor multiple lamps.
The irony with this requirement is that under-dosing that can occur because one UV sensor monitors more than one lamp is typically less than 20%, which is much less under-dosing that can occur because the UV sensor does not properly monitor low wavelength UV dose delivery.
The PMO also states that all particles passing through the UV reactor receive the minimum dose. This language is essentially stating that the minimum UV dose of the UV dose distribution delivered by the reactor must meet the UV dose requirement, as opposed to the RED. All reactors, without exception, deliver a UV dose distribution, and the RED measured during validation is not the minimum UV dose of the dose distribution. Hence, this requirement cannot be demonstrated by UV systems that have been validated using microspheres, since microspheres measure the UV reactor’s dose distribution.
Last, the PMO requires that all UV systems use a real time UV-T analyzer to assure that the dose is always calculated accurately. However, the UVDGM describes validated UV dose monitoring algorithms that do not require an online UV-T analyzer. As described in Section D.2.1 of the UVDGM, with an optimally placed UV sensor, there is a single relation between UV dose delivery and the UV sensor readings that can be used to define a UV dose monitoring algorithm that does not require a UV-T monitor.
There are many UV systems on the market that have validation algorithms that use this approach to define operation for 4-log adenovirus credit. This requirement of the PMO prevents those systems from participating in this market.
Contact: Harold Wright, HWright@carollo.com