By Ilan Arvelo1*, Ernest R. Blatchley III2, William P. Bahnfleth3, Phil Arnold1, Ashley Fry1, Maria Topete4, Ling Zhou4, William Palmer5, Patrick J. Piper6, Jianping Zhang4, W. Andrew Dexter7, Nilson Palma1, Nicholas J. Heredia 6
1. SafeTraces Inc., 2. Purdue University, 3. The Pennsylvania State University, 4. Bolb Inc., 5. AeroMed Inc., 6. Far UV Technologies Inc., 7. Aerosol Research and Engineering Laboratories Inc. *Corresponding author
Airborne exposure to pathogens, including viruses like coronaviruses (responsible for COVID-19 and some common cold strains), influenza, measles, respiratory syncytial virus (RSV), Human metapneumovirus (HMPV) and bacteria, such as M. tuberculosis, is a significant factor in the transmission of the infectious diseases they cause. 1 Mitigating the airborne spread of these pathogens is crucial for public health. Interventions such as increased air exchange, filtration and ultraviolet germicidal irradiation (UVGI) aim to reduce the concentration of viable pathogens in the air; hence, reducing the risk of infection by reducing inhalational exposure. 2 Among these interventions, UVGI systems hold great promise for effective pathogen control, offering both significant efficacy and cost-effectiveness in terms of capital and operating expenses. 3
The effectiveness of an intervention may vary across different settings. Designing and optimizing such systems necessitates a comprehensive approach that combines numerical simulations and empirical testing. For example, an air-cleaning system for a hospital might greatly benefit from design and optimization, whereas, for non-critical environments such as a residential setting, such modeling and optimization would be impractical and cost prohibitive. 4 Numerical simulations, such as Computational Fluid Dynamics (CFD) and fluence-rate field models (e.g., ray tracing), provide insights into the potential distribution and impact of UVGI within enclosed spaces. While CFD was not employed in the current study, it is worth noting that CFD commonly is used to simulate indoor air quality (IAQ) dynamics in the built environment, although its broad application in commercial building settings can be challenging. 5,6
Empirical testing, on the other hand, involves experiments using non-pathogenic challenge agents to quantify inactivation or physical separation under various operating conditions. Conventionally, such tests have been conducted in specialized environments, like IAQ chambers. However, a critical challenge arises in translating test results from controlled environments to commercial building application settings. Currently, there is no method that combines mimicking the particle size distribution of a human upper respiratory aerosol emission that can be used for onsite testing of UVGI system efficacy, highlighting the need to develop robust new test methods and associated analyses.
An important limitation on effective application of the current methods for reducing human exposure to airborne pathogens in public spaces is the lack of a safe, single indicator that can represent the effectiveness of air purification devices, while taking into account the multiple mechanisms that affect the pathogen decay rate. Given the inability to assess installed effectiveness, it often is difficult to justify the cost of air filtration and cleaning devices, such as filters or UVGI fixtures.
Respiratory aerosols can be generated from alveolar, bronchiolar, bronchial, laryngeal and oral fluids. 7,8 Airborne pathogens from human emissions are released in these fluids, then they desiccate to a fraction of their initial size 9, depending on initial particle size and environmental conditions. Their concentration in air will diminish by gravitational deposition, natural inactivation, removal by filters, dilution by the introduction of clean outside air, inactivation by exposure to UV radiation and other causes.
This study evaluates a test method based on a UV-sensitive aerosol tracer that utilizes DNA as a tracer molecule subject to similar decay mechanisms as other airborne pathogens from a human emission, in order to address the lack of practical aerosol test methodologies. Nucleic acids, such as DNA, are ideal model substrates because they are one of the major components of viruses and bacteria that are susceptible to damage by UV wavelengths, which contributes to their germicidal inactivation. 10 The DNA-tagged liquid released in aerosol form is quantifiable and its concentration is sensitive to deposition, filtration, dilution and UVGI exposure.
Harding et al, 2016, introduced the use of DNA for tracking aerosol movement. One of the main advantages noted in their study was the ability to distinguish tagged particles from background aerosol concentration (given that the DNA sequences used are not naturally present in the air), and that the DNA can be carried in food additives generally recognized as safe. 11 DNA-based aerosol tracers commonly are used to assess ventilation and filtration of HVAC systems in the built environment 12; however, until now, they have not been used to measure the impact of UVGI fixtures.
This study utilized a DNA tracer system comprising UV-resistant (Tag-D1) and UV-sensitive (Tag-LM4) sequences, designed to measure physical removal effects separately from UV-C radiation exposure. By employing controlled UV exposure experiments and conducting aerosolization studies in commercial buildings, the study authors aimed to provide empirical data linking DNA-tagged aerosols to bacteriophage aerosol UV response, shedding light on the intricate dynamics of UV-sensitive aerosols indoors. This multidimensional approach contributes to the broader discussion of optimizing IAQ and safety, acknowledging the diverse settings and the need for context-specific solutions.
The system, utilizing short DNA molecules as tracer molecules and analyzed via droplet digital polymerase chain reaction (ddPCR), offers a promising means of quantifying DNA-tagged aerosols on air filters and assessing their removal by ventilation, with the inclusion of a UV-sensitive tag facilitating quantification of UV-C exposure. The focus was on the development and deployment of UV-sensitive aerosol technology, particularly in understanding the interaction between airflow dynamics and UV-C fluence rate fields within environments equipped with UVGI fixtures. Differential analysis between the UV-resistant and UV-sensitive tracers allows assessment of the impact of UVGI fixtures on the local environment, aiding in estimating aerosol-associated pathogen inactivation achieved through UVGI deployment. This method provides a means to quantify physical separation effects by filtration or air exchange, as well as pathogen inactivation resulting from UV-C exposure, and can be applied directly in occupied settings, eliminating the need for translation from test to application environments.
The objectives of this study were to demonstrate the possibility of using selected DNA sequences as indicators of UV-C exposure by means of their decay rate in surfaces and aerosol form. Furthermore, the authors aimed to correlate DNA reduction rate due to UV-C exposure with a pathogen surrogate microorganism, such as bacteriophage MS2, in aerosol form inside a controlled test environment. Lastly, the study aimed to show the DNA indicator’s applicability in a commercial setting as a way to assess the effectiveness of different UVGI systems used for pathogen control.
Materials and Methods
DNA-Tagged Liquid Suspension Preparation
The DNA-Tag tracer solutions were formulated with 99% water and 1% solids, composed of DNA and proprietary, non-toxic components that are generally regarded as safe (GRAS) by the FDA. The DNA oligonucleotides, purchased from Integrated DNA Technologies (IDT), were custom sequences of fewer than 200 base pairs each. The UV-sensitive tag sequence underwent prior optimization for its response to UV radiation emitted by an ESCO CRF UV-30A low-pressure mercury arc lamp (nearly monochromatic emission at a characteristic wavelength of 254 nm).
The UV-sensitive tracer was designed to incorporate UV-sensitive DNA sequence motifs known to produce photolesions upon UV exposure, such as “pyrimidine dimers, cyclobutane pyrimidine dimers (CPDs) and pyrimidine-pyrimidone (6–4) photoproducts [(6–4)PPs] between adjacent bases in DNA.” 13,14 Such DNA damage inhibits the replication of the UV-exposed DNA during amplification in a PCR reaction. 15 This results in a signal reduction from the UV-exposed DNA that can be measured from fluorescence signal generated in a TaqMan assay that targets the DNA molecules. The UV-resistant tag was designed to exclude thymine dimers and sequences prone to CPDs. The DNA-tags have been qualified to be stable under ambient office lighting conditions and have a shelf life of at least nine months.
Proprietary sequences of the DNA molecules used as tracers were inspired by naturally occurring sequences that would not be found in the test environment, as well as published literature on UV effects on DNA sequences. 16 The concentration of DNA in the tag solution was approximately 4,875,000,000 copies per µL for the UV-sensitive tag and 3,700,000,000 copies per µL for the UV-insensitive tag, as determined by TaqMan assays via ddPCR (QX200 system, Bio-Rad Laboratories) after extraction from coupons with an extraction buffer (see below methodology).
DNA-Tag Sensitivity to UV Radiation on Surfaces
Coupons were created by applying 50 µL of the tag solution to foil coupons (PCR plate heat seals, Bio-Rad Laboratories, part number 1814040), air-drying them, and subsequently exposing them to a controlled range of UV-C doses. Rectangular foil coupons (dimensions: 6.98 cm by 8.26 cm) were used for exposure of the DNA tags to UV-C radiation. A circle (diameter = 5.08 cm) was drawn on each coupon and 50 µL of tag solution was spotted and air-dried within the circle. Foil coupon UV-C exposures were conducted under collimated beams 17 that were built around the UV-C sources described in Table 1.
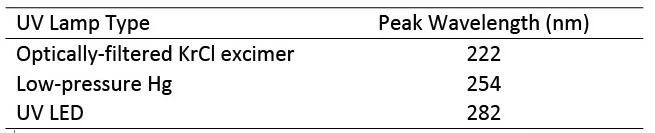
The optically-filtered KrCl lamp emits peak irradiance at 222 nm, with a full width at half maximum (FWHM) bandwidth of roughly 2 nm. The low-pressure Hg lamp essentially is monochromatic at 254 nm, with a FWHM bandwidth of less than 1 nm. The UV LEDs used in this experiment have an emission peak at about 282 nm, with a FWHM bandwidth of roughly 10 nm. All three sources have minor emission lines at longer wavelengths.
For each UV source type, exposures were controlled to achieve delivered UV doses of 10, 20, 30, 50 and 100 mJ/cm2. Triplicate exposures were conducted for each dose. Exposure times required to deliver these target doses were calculated based on measured values of incident irradiance at the horizontal planar surface located below the end of each collimated beam where samples were exposed. Incident irradiance at these locations was measured for each collimated UV source using a radiometer (International Light IL-1700 with SED-008 detector), calibrated against a NIST-traceable standard at each of the peak wavelengths indicated in Table 1. Following UV exposure, coupons were returned to SafeTraces’ laboratories in light-protective bags for DNA quantification by ddPCR.
Bacteriophage Liquid Suspension
Pure strains of the MS2 bacteriophage (ATCC 15597-B1) and its host bacterium (E. coli ATCC 15597) were obtained from ATCC by Aerosol Research and Engineering Laboratories, Inc. (ARE Laboratory). To culture MS2, liquid media was inoculated with the bacteriophage during the logarithmic growth phase of the host bacteria. After an appropriate incubation period (37⁰ C, overnight 16 h ± 2 h), cells were lysed and cellular debris separated by centrifugation. MS2 yields were greater than 1011 plaque forming units (pfu) per mL with a single amplification procedure. The stock suspension then was diluted with phosphate buffered saline (PBS, Bioland Scientific LLC; Cat: PBS01-03) to a target of 1010 pfu/mL, before it was used to generate MS2-tagged aerosols with a pneumatic nebulizer (SafeTraces, Inc., model ES-1 eSprayer).
Aerosol Generation Device
The device works with a pressurized air tank at 448.2 kPa, connected by a line to a liquid reservoir and a spray nozzle. The liquid reservoir contains the target tracer at a known concentration. The DNA-tagged liquid suspension and the bacteriophage liquid suspension were sprayed independently and simultaneously using the same model of pneumatic nebulizers (SafeTraces, Inc.). The particle size distribution generated by this pneumatic nebulizer using a similar DNA tracer solution was measured with a laser diffraction instrument (Spraytec, Malvern Panalytical Ltd.), placed 0.15 m from the nebulizer nozzle, the volumetric median particle size was 24.05 ± 0.25 um (SD from triplicate) with 10th and 90th percentiles of 6.96 and 79.23 um, respectively12.
Aerosolization of DNA-Tagged and Bacteriophage Suspensions in Test Chamber
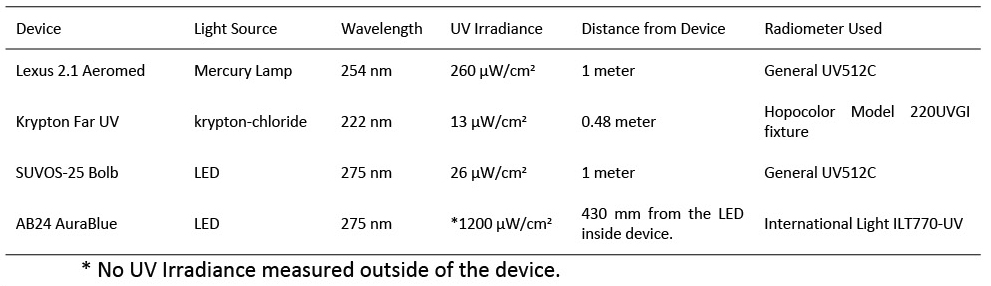
To test sensitivity to UV radiation, liquid suspensions were aerosolized within a 1,050 cubic feet (30 m3) test chamber with both DNA-Tagged and MS2 bacteriophage. Four UVGI fixtures were used for UV exposure (Table 2): Aeromed Lexus 2.1 is an upper room UVGI device at 254 nm; Far UV Krypton is a whole room irradiation device at 222 nm wavelength 18-20 that is optically filtered from 200-230 nm; Bolb SUVOS-25 is an LED device for unoccupied space disinfection at 275 nm wavelength; and the AuraBlue AB24 is an air troffer with enclosed 275 nm UV LEDs, with an internal fan that was run at 160 CFM (271.8 m3/h), low power mode, but could be run at a flow rate as high as 430.3 CFM (731 m3/h).
A control condition with no UV device was included to assess natural aerosol decay. The UV devices were placed in the chamber successively, oriented to the center of the room and removed before the next device was tested. At least three independent replicates of aerosol release, exposure to UV from the device for 1 h and sample collection were performed. An Optical Particle Sizer (OPS) (TSI, Inc., model 3330) was used to monitor the aerosolized particle size distribution, which was supported by monitoring the total particle concentration. Between experimental replicates, the air from the chamber was purged through HEPA-filters to outdoor air between 15 to 20 minutes until particle concentrations reached background levels confirmed by the OPS in real time.
Inside the test chamber, the simultaneous aerosolization of 5 mL DNA-tagged tracer and 5 mL bacteriophage MS2 in PBS and Tryptic soy broth (Neogen, Cat: NCM0004A) were performed using two separate pneumatic nebulizers to prevent potential mixing interactions that could interfere with DNA-tag sensitivity. The test chamber setup is shown in Figure 1. Two mixing fans located as shown and inclined 45 degrees upward from the horizontal plane were operated during the initial five minutes post-aerosolization to promote mixing. Fan specifications included Mixing fan 1 (Amazon, model fanmk01) providing 197 CFM (334.7 m3/h), Mixing fan 2 (Honeywell, model HTF1220B) producing a flow of 478 CFM (812.1 m3/h) and one ceiling fan (4.5 ft diameter) maintaining continuous airflow at 613 CFM (1041.5 m3/h). Temperature and relative humidity were monitored throughout all experiments (AC infinity, model Controller 69), with ranges of 17.8-24.4° C and 39%-50% RH, respectively (with a maximum change of 1.1° C and 1% RH within replicates).
Air Sampling
DNA-tagged aerosols were sampled with an automatic air sampling system (SafeTraces, Inc., model AS-4 AutoSampler). The system consisted of four devices; each one capable of collecting four sequential air filter samples given a defined sampling interval duration (Figure 2). The system was equipped with a pump calibrated at 5.5 ± 0.1 L/min, and the air passed through a 25 mm glass microfiber filter with a 1.0 μm nominal pore size (grade A-E, Sterlitech Corp.). This allowed for precise and controlled sample collection, ensuring the retrieval of airborne particles containing the DNA tracer. The filters were held inside a cassette (25 mm, clear styrene, SKC PN 225-2-25LF), and at the end of the programmed sampling period collected and sent to the laboratory (SafeTraces) for DNA quantification.
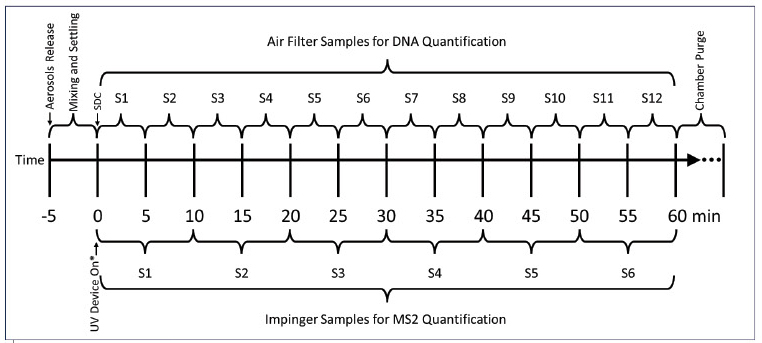
Additionally, two AGI-30 impingers were used to sample the air inside of the chamber for bacteriophage quantification. These impingers were connected to two ports on opposite ends of the chamber to obtain a representative air sample. The AGI-30 impingers were designed with a critical orifice that pulled at precisely 12.5 LPM when connected to a vacuum. These impingers impacted the aerosol into 20 mL of PBS with an addition of 0.005% volume of Tween 80 (Sigma-Aldrich; Cat P4780). Each sample was collected for a period of 10 minutes to get a suspension of bacteriophage from the aerosols in the air. For each sampled interval, the two suspensions were mixed and sent to the laboratory (ARE) for quantification.
DNA Tracer quantification
To elucidate the impact of UV exposure on the DNA tags, the highly sensitive quantitative ddPCR approach 21 was used. This technique allowed for the precise quantification of specific DNA sequences. ddPCR utilizes water-oil emulsion technology to fractionate the reaction volume into approximately 20,000 droplets. Each droplet underwent PCR amplification, which enabled the measurement of thousands of amplification events within a single reaction well.
The DNA tags from the foil coupons were extracted for subsequent analysis by washing with a proprietary aqueous buffer solution. Similarly, the Sterlitech 1-micron (AE2500) cassette filters integrated into SafeTraces air samplers were subjected to DNA extraction using the same buffer composition used for the foil coupons. The samples were diluted to an appropriate concentration to fall within the optimum range (0 to 5,000 copies per μL) for the ddPCR system. The comprehensive sample processing and dilution steps were implemented to guarantee that the subsequent ddPCR analysis would yield reliable quantitative results, enabling a detailed assessment of the impact of UV exposure on the DNA tags under various experimental conditions.
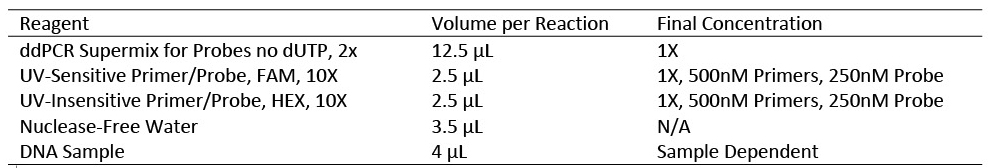
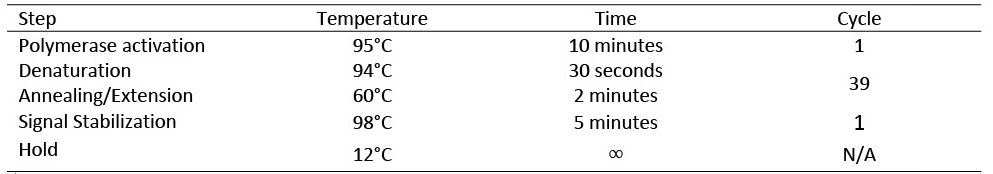
The reagents utilized in the ddPCR amplification included ddPCR Supermix for Probes no dUTP [ddPCR Part Number: 1863025] and two TaqMan probe assays. Each TaqMan probe was unique to one sequence, enabling discrimination between the two targets by the use of distinct fluorophores. The TaqMan probe for the UV-resistant tag was labeled with the HEX fluorophore, while the TaqMan probe for the UV-sensitive tag was labeled with the FAM fluorophore. Each TaqMan probe was custom ordered and acquired from IDT.
To generate the droplets required for ddPCR, Droplet Generation Oil for Probes [ddPCR Part Number: 1863005], ddPCR 8-Well Cartridges [ddPCR Part Number: 1864008], ddPCR Gasket Seals for 8-Well Cartridges [ddPCR Part Number: 1863009], a DG8 Cartridge Holder and a QX200™ Droplet Generator were used. The consumables required for ddPCR analysis consisted of ddPCR 96-well Plates [ddPCR Part Number: 12001925] and PCR Plate Heat Seals [ddPCR Part Number: 1814040]. To perform the ddPCR analysis a PX1 PCR™ Plate Sealer, a C1000 Touch™ Thermal Cycler and a QX200™ Droplet Reader were utilized.
DNA-Tracer Quantification Experimental Protocol
Each diluted DNA sample, extracted from foil coupons and air sampler cassettes, was subjected to ddPCR analysis using the specified TaqMan probes. The amplification reactions were performed on a ddPCR thermal cycler, and the resulting droplets were analyzed using the QX200 Droplet Reader.
This method allowed for the quantification of both UV-sensitive and UV-insensitive tags, providing a robust means to assess the effectiveness of UV exposure in altering the DNA tags’ integrity. The utilization of specific TaqMan probes and associated consumables ensured the accuracy and reliability of the ddPCR-based analysis.
Bacteriophage Quantification
The liquid suspensions obtained from impingers sampling air from the chamber were serially diluted with PBS (containing Tween 80, as described in the section air sampling) and plated in triplicate. This was done using a standard drop plaque assay technique onto tryptic soy agar plates (Hardy Diagnostics) with its host (E. coli). Plates were incubated at 37॰ C overnight (between 12 to 16 hours) and the enumeration was recorded by quantifying the plaques formed on the plates. 22 Technical triplicate results from each sample were averaged, and the concentration in the sample suspension as pfu/mL was determined. This value was used to calculate the total pfu collected in the sample (based on the 20 mL collected), with this and the total volume of air sampled the calculation of the concentration as pfu per L of air was obtained.
Statistical Analysis
All data organization, data cleaning, figures and statistical analysis were performed with R version 4.0.3 and packages contained in the Tidyverse. 23,24 For coupons, the total DNA copies quantified per sample were transformed to Log base 10, and this value was used as the dependent variable in a linear regression model 25 with dose as the independent variable. For liquid aerosols containing DNA-tags or MS2 bacteriophage, quantified results as concentration in units of DNA copies per L of air, or pfu per L of air were used to calculate their decay rate, which was assumed to be a first-order process. Within experimental replicates, each value was standardized by calculating the natural log of the ratio of concentration after a given exposure period to the initial concentration observed in the same experimental replicate of aerosol emission and sampling.
Equation 1
Aerosol Tag Reduction = Ln(Ci/C0)
Aerosol Tag Reduction = the normalized natural log reduction of the DNA-Tag or MS2 bacteriophage concentration
Ci = concentration at time i
C0 = initial concentration as a reference point, defined as time 0 minutes from aerosols decay
The aerosol tag reduction values were transformed to positive magnitude and used as the dependent variable in a regression model using time as the independent variable. The initial time (time = zero) was defined as five minutes after aerosols release to provide enough time for aerosols to mix in the air and a stable log-linear decay rate measurement. This point is called the “Start of the Decay Curve’’ (SDC), similar to how it is described in the ASHRAE standard 241 Appendix C. 26
An exception was made for the SUVOS-25 Bolb device, for which the SDC was defined to be 10 minutes after aerosols were released, given that when observing the data, it was noted that more time was needed to have a log-linear decay for this device setting for the bacteriophage MS2. This exception was necessary, because the SUVOS-25 Bolb device had to be on during the initial air mixing period of five minutes with mixing fans on, albeit it was rigged with a flap to cover the UV LEDs, which was triggered to drop after the five minutes.
This was not the case for the other three devices tested, which were turned on remotely after five minutes of air mixing. The authors believe that even though the flap was to prevent early exposure to UV from SUVOS-25, there was some aerosol being affected by UV behind the flap in the aerosol mixing period, which may have contributed to some signal instability during that time. The SUVOS-25 Bolb device is not intended for occupied spaces.
Air mixing is important for reaching equilibrium of the aerosol and is allowed in testing according to the ASHRAE 241 standard. One model slope was obtained for each aerosol tag (MS2, Tag-D1, Tag-LM4) and device condition (UVGI off as control, plus 4 devices) combination (total = 15). The slope of the decay rate was interpreted as the equivalent air changes per hour (eACH), similar to how air changes per hour are calculated in the ASTM Method E741-11, which is used for measuring the air change rate in a room with outdoor air by means of a tracer gas. 27
Equation 2
Y = aX + b
where:
Y = – Aerosol Tag Reduction (Equation 1)
a = slope, interpreted as eACH
X = time since Start of Decay Curve in hours
b = Y value when time equals zero (intercept)
For all the models, a significance level of 5% was used to reject the null hypothesis of no reduction given increased time (or dose) of exposure to UV.
The effectiveness of each UVGI device also was calculated in the form of equivalent clean airflow delivery rate as described in the ASHRAE standard 241 Appendix A for getting a better understanding on scalability of the results.
Equation 3
VACS = V*(Ktd – Knd)
where:
VACS = air cleaning system equivalent clean airflow rate, CFM
V = test chamber volume, ft3
Ktd = infectious microorganism (MS2) decay rate with air cleaning system operating, minute-1
Knd = infectious microorganism (MS2) decay rate without air cleaning system operating, minute-1
Part 2 of this article, featuring the experiment results, will appear in Issue 2 2025 of UV Solutions.
References
- N.H.L. Leung, Transmissibility and transmission of respiratory viruses, Nat. Rev. Microbiol. 19 (2021). https://doi.org/10.1038/s41579-021-00535-6.
- B.F. Leo, C.Y. Lin, K. Markandan, L.H. Saw, M.S. Mohd Nadzir, K. Govindaraju, I.I. Shariffuddin, R. Sankara, Y.W. Tiong, H. Pakalapati, M. Khalid, An overview of SARS-CoV-2 transmission and engineering strategies to mitigate risk, J. Build. Eng. 73 (2023) 106737. https://doi.org/10.1016/j.jobe.2023.106737.
- E.A. Nardell, S.J. Bucher, P.W. Brickner, C. Wang, R.L. Vincent, K. Becan-McBride, M.A. James, M. Michael, J.D. Wright, Safety of upper-room ultraviolet germicidal air disinfection for room occupants: Results from the Tuberculosis Ultraviolet Shelter Study, Public Health Rep. 123 (2008) 52–60. https://doi.org/10.1177/003335490812300108.
- F. Ibrahim, E.Z. Samsudin, A.R. Ishak, J. Sathasivam, Hospital indoor air quality and its relationships with building design, building operation, and occupant-related factors: A mini-review, Front. Public Heal. 10 (2022). https://doi.org/10.3389/fpubh.2022.1067764.
- C.A. Gilkeson, C.J. Noakes, M.A.I. Khan, Computational fluid dynamics modelling and optimization of an upper-room ultraviolet germicidal irradiation system in a naturally ventilated hospital ward, Indoor Built Environ. 23 (2014). https://doi.org/https://doi.org/10.1177/1420326X14532933.
- A. Alani, I.E. Barton, M.J. Seymour, L.C. Wrobel, Application of Lagrangian particle transport model to tuberculosis (TB) bacteria UV dosing in a ventilated isolation room, Int. J. Environ. Health Res. 11 (2001). https://doi.org/https://doi.org/10.1080/09603120020047000.
- C.C. Wang, K.A. Prather, J. Sznitman, J.L. Jimenez, S.S. Lakdawala, Z. Tufekci, L.C. Marr, Airborne transmission of respiratory viruses, Science (80). (2021). https://doi.org/10.1126/science.abd9149.
- G.R. Johnson, L. Morawska, Z.D. Ristovski, M. Hargreaves, K. Mengersen, C.Y.H. Chao, M.P. Wan,Y. Li, X. Xie, D. Katoshevski, S. Corbett, Modality of human expired aerosol size distributions, J. Aerosol Sci. 42 (2011) 839–851. https://doi.org/10.1016/j.jaerosci.2011.07.009.
- N. Clements, I. Arvelo, P. Arnold, N.J. Heredia, U.W. Hodges, S. Deresinski, P.W. Cook, K.A. Hamilton, Informing Building Strategies to Reduce Infectious Aerosol Transmission Risk by Integrating DNA Aerosol Tracers with Quantitative Microbial Risk Assessment, Environ. Sci. 48 Technol. 57 (2023) 5771–5781. https://doi.org/10.1021/acs.est.2c08131.
- W. Kowalski, Ultraviolet germicidal irradiation handbook: UVGI for air and surface disinfection, 2009. https://doi.org/10.1007/978-3-642-01999-9.
- R.N. Harding, C.A. Hara, S.B. Hall, E.A. Vitalis, C.B. Thomas, A.D. Jones, J.A. Day, V.R. Tur-Rojas, T. Jorgensen, E. Herchert, R. Yoder, E.K. Wheeler, G.R. Farquar, Unique DNA-barcoded aerosol test particles for studying aerosol transport, Aerosol Sci. Technol. 50 (2016) 429–435. https://doi.org/10.1080/02786826.2016.1162903.
- I. Arvelo, F. Pagone, J. Persky, C.E. Carpio, P. Arnold, N. Clements, Decay rates of two tracer gases compared to DNA-tagged liquid aerosol tracer particles: Impact of varying dilution rate and filtration, Build. Environ. 212 (2022) 108819. https://doi.org/10.1016/j.buildenv.2022.108819.
- M.G. Kemp, A. Sancar, DNA excision repair: Where do all the dimers go? Cell Cycle 11 (2012) 2997–3002. https://doi.org/10.4161/cc.21126.
- L.H.F. Mullenders, A.-M. Hazekamp-van Dokkum, W.H.J. Kalle, H. Vrieling, M.Z. Zdzienicka, A.A. van Zeeland, UV-induced photolesions, their repair and mutations, Mutat. Res. Toxicol. 299 (1993) 271–276. https://doi.org/10.1016/0165-1218(93)90103-K.
- J.A. Sikorsky, D.A. Primerano, T.W. Fenger, J. Denvir, DNA damage reduces Taq DNA polymerase fidelity and PCR amplification efficiency, Biochem. Biophys. Res. Commun. 355 (2007) 431–437. https://doi.org/10.1016/j.bbrc.2007.01.169.
- M. Otaki, Y. Higashino, Y. Yamada, Experimental validation of determinants of UV sensitivity using synthetic DNA, J. Photochem. Photobiol. 12 (2022) 100139. https://doi.org/10.1016/j.jpap.2022.100139.
- S. Lim, E.R. Blatchley, UV Dose-Response Behavior of Air-Exposed Microorganisms, J. Environ. Eng. 138 (2012) 780–785. https://doi.org/10.1061/(ASCE)EE.1943-7870.0000535.
- M. Buonanno, D. Welch, I. Shuryak, D.J. Brenner, Far-UVC light (222 nm) efficiently and safely inactivates airborne human coronaviruses, Sci. Rep. 10 (2020) 1–8. https://doi.org/10.1038/s41598-020-67211-2.
- D. Welch, M. Buonanno, V. Grilj, I. Shuryak, C. Crickmore, A.W. Bigelow, G. Randers-Pehrson, G.W. Johnson, D.J. Brenner, Far-UVC light: A new tool to control the spread of airborne-mediated microbial diseases, Sci. Rep. 8 (2018) 1–7. https://doi.org/10.1038/s41598-018-21058-w.
- E.R. Blatchley, D.J. Brenner, H. Claus, T.E. Cowan, K.G. Linden, Y. Liu, T. Mao, S.J. Park, P.J. Piper, R.M. Simons, D.H. Sliney, Far UV-C radiation: An emerging tool for pandemic control, Crit. Rev. Environ. Sci. Technol. 53 (2023) 733–753. https://doi.org/10.1080/10643389.2022.2084315.
- B.J. Hindson, K.D. Ness, D.A. Masquelier, P. Belgrader, N.J. Heredia, A.J. Makarewicz, I.J. Bright, M.Y. Lucero, A.L. Hiddessen, T.C. Legler, T.K. Kitano, M.R. Hodel, J.F. Petersen, P.W. Wyatt, E.R. Steenblock, P.H. Shah, L.J. Bousse, C.B. Troup, J.C. Mellen, D.K. Wittmann, N.G. Erndt, T.H. Cauley, R.T. Koehler, A.P. So, S. Dube, K.A. Rose, L. Montesclaros, S. Wang, D.P. Stumbo, S.P. Hodges, S. Romine, F.P. Milanovich, H.E. White, J.F. Regan, G.A. Karlin-Neumann, C.M. Hindson, S. Saxonov, B.W. Colston, High-throughput droplet digital PCR system for absolute quantitation of DNA copy number, Anal. Chem. 83 (2011) 8604–8610. https://doi.org/10.1021/ac202028g.
- A. Mazzocco, T.E. Waddell, E. Lingohr, R.P. Johnson, Enumeration of Bacteriophages Using the Small Drop Plaque Assay System, in: 2009: pp. 81–85. https://doi.org/10.1007/978-1-60327-164-6_9.
- R Core Team, R: A Language and Environment for Statistical Computing, (2020). https://www.r-project.org/.
- H. Wickham, M. Averick, J. Bryan, W. Chang, L. McGowan, R. François, G. Grolemund, A. Hayes, L. Henry, J. Hester, M. Kuhn, T. Pedersen, E. Miller, S. Bache, K. Müller, J. Ooms, D. Robinson, D. Seidel, V. Spinu, K. Takahashi, D. Vaughan, C. Wilke, K. Woo, H. Yutani, Welcome to the Tidyverse, J. Open Source Softw. 4 (2019) 1686. https://doi.org/10.21105/joss.01686.
- E.J. Dietz, W. Mendenhall, T. Sincich, A Second Course in Statistics: Regression Analysis, J. Am. Stat. Assoc. 92 (1997) 797. https://doi.org/10.2307/2965740.
- ASHRAE, Standard 241, Control of Infectious Aerosols, (2023).
- ASTM International, ASTM E741 – 11(2017) Standard Test Method for Determining Air Change in a Single Zone by Means of a Tracer Gas Dilution, ASTM, West Conshohocken, 2017.