By Traci Brooks, Senior Technologist – UV Disinfection, and Harold Wright, Chief Technologist – UV, Carollo Engineers
UV validation typically involves the following steps:
- Define the test plan based on the UV dose monitoring algorithm used by the UV reactor, the targeted market for the UV reactor (i.e., drinking water, wastewater, potable or non-potable reuse), target pathogens and log inactivation, and the relevant guidelines.
- Install the UV reactor at the test facility using inlet piping that meets relevant guidelines.
- Conduct functional testing to determine the dependence of the UV sensor readings on UVT and ballast power setting.
- Conduct biodosimetric testing to measure log inactivation with each test condition of flow, UVT and lamp output based on the test plan. Microbial surrogates typically are MS2 and T1UV phage, as specified by relevant guidelines.
- Analyze data to define UV dose monitoring algorithms.
- Summarize results in a validation report.
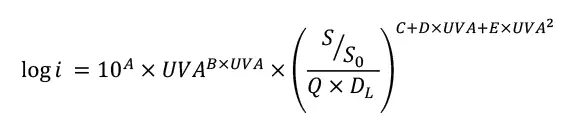
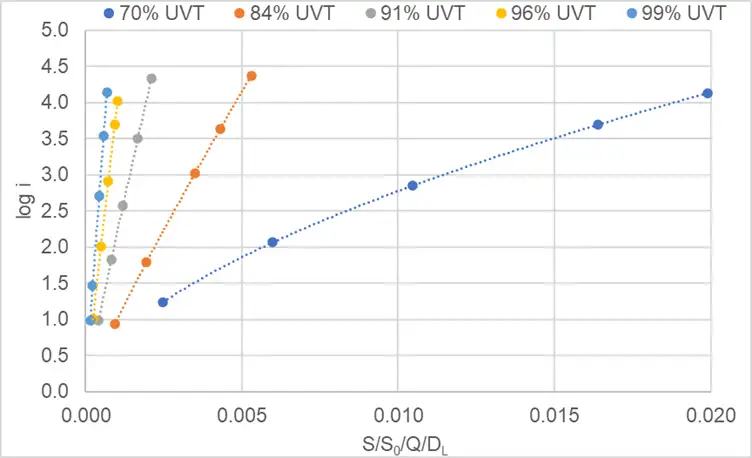
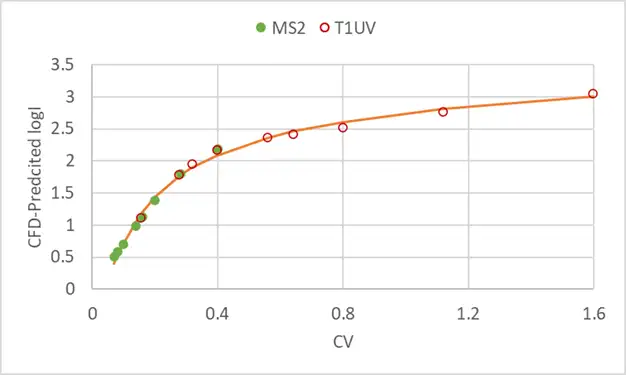
Most UV dose monitoring equations incorporate the use of the combined variable, defined as S/S0/Q/DL, where S/S0 is the relative lamp output, Q is the flow and DL is the UV dose per log inactivation of the microbe whose log inactivation is being predicted. The relationship between the log inactivation and the combined variable will lie along a single relationship at a given UVT, as shown in Figure 1. Following approaches described in the Innovative Approaches document, this relationship then can be used to fully define the UV dose monitoring equation for a given reactor. An example UV dose monitoring equation is shown in Equation 1, where UV-A is defined as the UV absorbance of the test water and the coefficients are defined through a regression analysis of the data.
Higher Levels of Disinfection
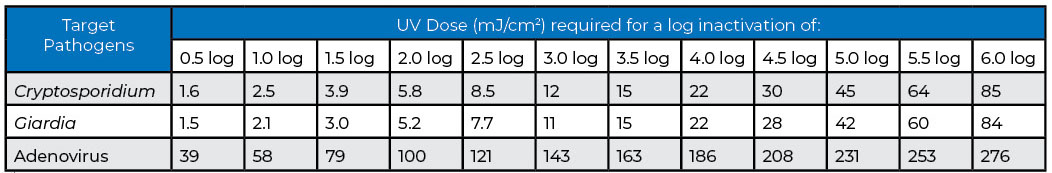
In recent years, UV applications have been calling for higher levels of disinfection, including 5 log inactivation of polio for NWRI and 6 log inactivation of adenovirus for direct potable reuse. Table 1 shows the UV dose values required for 0.5 to 6.0 log inactivation of Cryptosporidium, Giardia and Adenovirus. As a result, the authors’ company has started performing validations that demonstrate 6 log inactivation using MS2 and T1UV phage.
To demonstrate 6 log inactivation, a high-volume assay is used to lower the detection limit with the measurement of microbial surrogate concentrations in the UV reactor effluent. With this method, a sample volume up to 100 mL is plated, which lowers the detection limit by 100-fold compared to using 1 mL.
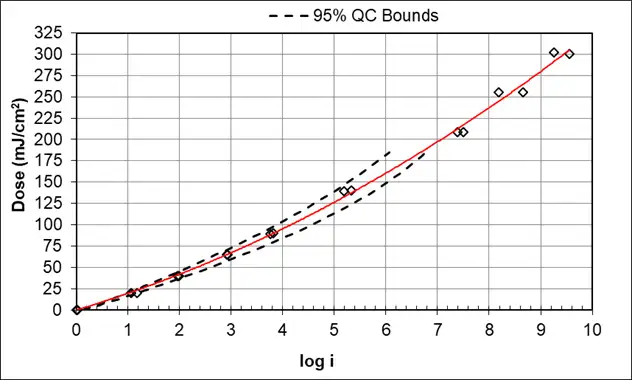
This approach toward measuring 6 log inactivation is more practical than using higher influent concentrations, which would require large volumes of microbial stock solutions. Collimated beam samples also are spiked to extend the UV dose response curves to more than 6 log inactivation. Figures 2 and 3 show spiked MS2 and T1UV UV dose responses.
Impact of Short-Circuiting and Low-Dose Pathways Through UV Systems
Recent validations at the Carollo Engineers’ Portland UV Validation Facility have shown that low UV dose pathways through the UV reactor can have notable impacts on achieving 5 or 6 log inactivation. The impacts of short-circuiting often are seen as tailing in the relationship between log inactivation and the combined variable. These impacts can happen with even a very small amount of by-pass of untreated water. An example from using Computational Fluid Dynamic models (CFD) shows that 0.0069 gpm of by-pass of untreated water can compromise 5 log inactivation at 1 MGD, as shown in Figure 4.
Low-dose pathways in closed-vessel systems have been attributed to flow behind parked wipers, low UV intensity regions between the lamp electrode and the wall, and open inter-connected drain lines. Inlet piping into a UV system also can cause low-dose pathways if there is small-diameter piping that connects to a larger expansion into the reactor, which can cause jetting through the UV system.
Low-dose pathways in open-channel systems have been attributed to not fully sealing areas between modules and the sides of the channel or floor, distance between the lamp electrode and floor, water level above the top of lamps, a downstream weir located too close to the last bank, open drain lines, and leaking gates and valves.
Recommendations to Minimize Short-Circuiting
UV dose models based on CFD can be used to identify short-circuiting or low-dose areas in a UV system. When running the models, it is recommended to run at least 5,000 particle tracks to capture short circuiting that impacts tailing at 5 log and 50,000 particle tracks to capture short circuiting that impacts 6 log inactivation. These CFD-based UV dose models can be used by UV system manufacturers to optimize UV system design by identifying and addressing any short-circuiting before UV validation testing.
CFD models also can be used during the design process of new UV installations if there is a concern that the inlet piping may cause some jetting within the UV system at design flows. Using UVDGM piping or baffle plates in the inlet side of a UV system also could help prevent this type of short-circuiting with installed UV systems. When designing UV systems, it also is important to eliminate cross connections between parallel trains or channels and minimize the impact of leaking valves by using a block-and-bleed with standby reactors.
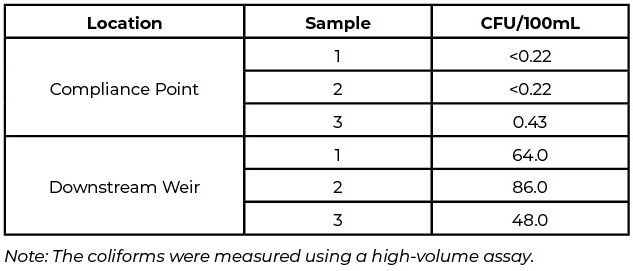
With wastewater UV systems, high coliform levels downstream of the UV system may indicate a bypass problem. Performing checks on the system in the form of an UV audit could be helpful in identifying the problem. When auditing the installed UV system, it especially is important to check for any interconnected drain lines and leaking valves or gates.
An example of this type of short-circuiting is described in Water Research Foundation Project 4764, UV Disinfection Knowledge Base for Reuse Applications. As part of a UV audit for an open-channel UV system used for non-potable reuse after tertiary filtration in accordance with NWRI guidelines, samples were collected at a compliance point immediately downstream of the last bank of UV lamps and at the effluent weir, which was located downstream of the compliance point. Total coliform concentration at the weir were 300-fold greater than concentration at the compliance point (Table 2). With this example, the increase in coliform concentration was caused by interconnecting floor drains. These observations may have public health implications.
Conclusion
In recent years, UV applications have been calling for higher levels of disinfection, and UV dose models based on CFD can be used to identify short-circuiting or low-dose areas in a UV system. These CFD-based UV dose models can be used by UV system manufacturers to optimize UV system design by identifying and addressing any short-circuiting before UV validation testing. CFD models also can be used during the design process of new UV installations.
Carollo Engineers has operated the Portland UV Validation Facility located in Portland, Oregon, since 2002. The validation facility is located at a Portland Water Bureau groundwater pumping station and has access to a 90 MGD groundwater supply. Carollo has conducted over 80 validations at UV reactor flows ranging from 5 gpm to 72 MGD. Validations include both closed-vessel and open-channel systems done in accordance with the USEPA’s UV Disinfection Guidance Manual (UVDGM), Innovative Approaches for Validation of Ultraviolet Disinfection Reactors for Drinking Water Systems, the Ultraviolet Disinfection Guidelines for Drinking Water and Water Reuse (National Water Research Institute [NWRI]/Water Research Foundation, August 2012) and the IUVA Uniform Protocol for Wastewater UV Validation Applications. Carollo also has worked with Technologiezentrum Wasser (TZW) to perform joint DVGW and UVDGM validations at its validation facility in Sankt Augustin, Germany. For more information, contact Traci Brooks at tbrooks@carollo.com and Harold Wright at hwright@carollo.com.
References
NWRI. 2012. Ultraviolet Disinfection Guidelines for Drinking Water and Water Reuse. Third Edition. National Water Research Institute, Fountain Valley, CA, in collaboration with American Water Works Association Research Foundation.
USEPA. 2006. Ultraviolet Disinfection Guidance Manual for the Final Long Term 2 Enhanced Surface Water Treatment Rule. EPA 815-R-06-007. United States Environmental Protection Agency, Office of Water, Washington, DC.
USEPA. 2006. Ultraviolet Disinfection Guidance Manual for The Final Long Term 2 Enhanced Surface Water Treatment Rule. EPA 815-R-06-007. U.S. Environmental Protection Agency, Office of Groundwater and Drinking Water, Washington, DC.
USEPA. 2020. Innovative Approaches for Validation of Ultraviolet Disinfection Reactors for Drinking Water Systems. EPA/600/R-20/09. United States Environmental Protection Agency, Office of Research and Development, Center for Environmental Solutions and Emergency Response (CESER), Cincinnati, OH
H. Wright, T. Brooks, M. Heath, E. Wicklein, B. Sotirakos, and A. Salveson. 2020. UV Disinfection Knowledge Base for Reuse Applications. Water Research Foundation, Denver, CO.