

By Pratibha Sharma, Ph.D., director of Applications Research and Development; Saya Han, sales director; and Peter Chung, marketing, Violumas
Ultraviolet (UV) light has been proven to enable many innovative applications in the curing 1 and disinfection space. 2 The UV-C region, spanning between 200 nm and 280 nm, specifically has garnered immense attention due to proven germicidal qualities and potential for use in advanced oxidation processes. With the need for air and water disinfection and the effort to eliminate mercury-based products, the world economies constantly seek measures to make the environment safer and more sustainable. Light-emitting diode (LED) technology has offered an attractive alternative, providing a mercury-free, energy-efficient option for various visible lighting applications. 3 UV LED technology offers a smaller form-factor, high radiant output, narrowband emission and an inherent versatility. Pacing itself to replace conventional lamps, the UV LED is paving the way for the development of customized and point-of-use products for unique disinfection and sterilization applications. 4
While visible LEDs have advanced with set testing and quality standards in place, UV-C LEDs, manufactured by fewer companies, are going through the challenging manufacturing and adoption phase, and proper protocols and testing standards still are getting established. 5 Since only a handful of industrial players have the capability to produce the UV-C die, customers who adopt these products encounter difficult issues where testing and operational data differs significantly between similar products, leading to mismatched expectations and uncertainty.
In this paper, the authors aim to highlight the various important parameters which a UV system designer must consider when assessing product datasheets. While the datasheet may provide the minimum necessary information to reject a product, the acceptance of a particular product must also be guided by thorough analysis of testing and operating conditions at which the data is generated. There exist many factors which can cause discrepancies from the product datasheet, but some of these issues can be mitigated by looking beyond the datasheet numbers.
Emission Spectrum and Binning
The first key parameters to understand from UV LED datasheets are peak wavelength (Wp) and full width half maximum (FWHM). Peak wavelength relates to the wavelength at which the spectral output reaches its highest intensity and is defined by material properties of the epitaxial growth layers on the wafer. After the wafer is diced into chips, the chips then are segregated into various bins based on peak wavelength, within a tolerance parameter (typically 3 to 5 nm). While UV LED emissions are fairly narrow, the spectral output does spread into a wavelength band resembling the Gaussian function. Because UV-C chips or bare die come from a diced epi, they can have a wide variability in quality. Even on the same epi, there can be low-grade and high-grade sections, along with some sections which may emit beyond the tolerance limits of Wp. For this reason, FWHM is useful for system designers for getting a snapshot of how much radiant flux is emitted in the Wp and the neighboring wavelengths.
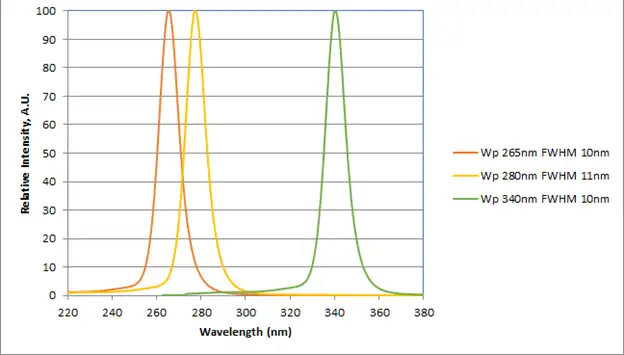
For example, as shown in Figure 1 , for a 265 nm Wp UV-C LED with a FWHM of 10 nm, it can be deduced that half of the maximum spectral output at 265 nm is emitted at (265-10/2=) 260 nm and at (265+10/2=) 270 nm. Two other curves (Wp = 280 and Wp =340 nm) have been included to show the effects of overlapping wavelengths. This is useful information for system designers that need precise output at a certain wavelength, allowing them to reduce radiant output at wavelengths that do not fulfill the application needs. It also is important to note that a 275 nm UV LED product can be produced from either a peak-275 nm epi or a peak-280 nm epi with reduced output at the 275 nm wavelength. Tighter binning in terms of the peak wavelength may be needed for applications such as curing.
In addition, the chip-binning criterion may vary between manufacturers, making the LED selection task more challenging. While some manufacturers use radiant output as their primary method of binning, others use forward voltage – and some may use a combination of the two. To design an optimal system, consistency in terms of the electro-optical characteristics is important. For this reason, it is important to pay attention to the manufacturer’s binning method and select chips accordingly for each application. Although the chips binned for a high radiant output may seem more attractive, these could come at a cost of higher voltage, drawing more power for the final application. Lower voltage chips on the other hand could be more ideal for creating a larger array, if a high enough radiant flux can be achieved. Chip binning also relates to the yield from the epi-wafer, and so the pricing could vary depending on the number of usable chips from each bin. So, cost considerations related to binning also must be taken into account.
Radiant Flux and Other Electro-Optical Characteristics
While the electrical characteristics and the optical output may appear to be two different parameters, their interdependency cannot be overstated and hence these are looked at in tandem. Although data sheets serve as a critical tool, it is important to note that many values cannot necessarily be compared directly between vendors. System designers need to understand that LED performance characteristics are highly dependent on operating conditions, and a thorough look at the electro-optical characteristics can help in selecting the most suitable UV LED for their applications.
Since UV-C LED products are seeing significant improvements in radiant flux, a higher optical output can be a sought-after feature for many end users. Radiant flux usually is the first parameter to be evaluated and is directly proportional to the forward current, until it reaches saturation. Even for products with comparable radiant flux, the drive current should be looked at carefully. For example, a 100 mW (radiant flux) UV LED may be driven at 350 mA in a certain product or at 700 mA. While the performance may be similar, the energy consumption could vary significantly. Different manufacturers may set varying standards for recommended driving current, depending on the chip size, reliability and performance. In the high-power UV-C LED products, this driving current can range from 100 mA to 600 mA, and even up to 700 mA. It is important to pay attention to the relationship between driving current and radiant flux illustrated by the Forward Current vs. Relative Radiant Flux chart (Figure 2) on data sheets.
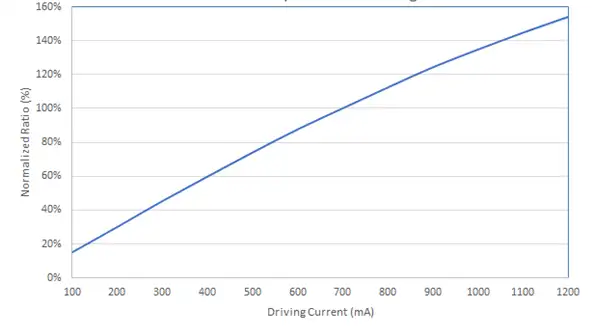
Typical UV LED datasheets provide values for the forward voltage and optical output at a certain drive current. While these values are very useful in ascertaining the device efficiency at a glance, analysis of the Forward Current vs. Relative Radiant Flux and the Forward Voltage vs. Forward Current graph is essential to understand and calculate device efficiencies. For those with a background in UV lamps, this explains why wall plug efficiency (WPE) of UV LEDs is not a great indicator of how an LED compares to a mercury lamp. WPE is calculated as Output Power/ (Forward Voltage x Driving Current). The same UV LED product can be calculated to have various WPE values, depending on the operating voltage, current and environmental conditions.
Another important section of the data sheet that should not be missed is the absolute maximum ratings of a UV LED. Absolute maximum ratings show conditions that should not be exceeded. Overstressing the product beyond the maximum voltage, current or temperature could lead to catastrophic failures. Checking absolute maximum ratings on each manufacturer’s datasheet is a good way to choose the product that best fits the application’s requirements without exceeding specified limits.
While the typical Electro-Optical Characteristics chart should give the UV LED performance at the manufacturer’s recommended conditions, the system designer also should understand that the radiant flux presented is not entirely indicative of the flux behavior or reliability of the product.
Thermal Characteristics Values
Often, users will find that the concepts of emission spectrum, radiant flux and operating conditions are not difficult to understand on a theoretical level. However, the reality of working with UV LEDs can be unexpected if understanding of a UV LED’s thermal behavior is limited. Thermal performance values often are not detailed enough on the datasheet but are critical indicators of how LEDs will perform in a real-life setting. Like all semiconductor devices, performance of UV LEDs is heavily influenced by temperature, and thermal conditions significantly impact the output flux and reliability.
In terms of LED lifetime (apart from catastrophic failure caused due to manufacturing and operating issues), LED lifetime is reported in terms of the LT70 data, which is the amount of time it takes for a UV LED to reach 70% of its original light output. Without effective heat dissipation, the LED will deteriorate at a quicker rate, even if operated at recommended ambient temperatures. On the data sheet, thermal resistance and absolute maximum junction temperature values can help a designer to compare various UV LED products, even from the same vendor. The junction temperature of an LED (Tj) is calculated as: 6
Tj = (Rth. P LED) + Ta
Rth includes the thermal resistance of the LED, the PCB and the heat sink, and represents the capability of the system to dissipate heat. The other two contributors are the power to the LED (P LED) and the ambient temperature (Ta). Even with the same UV LED chip, various LED package types may exhibit low to high thermal-resistance values. Metal substrates, such as copper and aluminum, offer high heat-dissipation coefficients and low Rth, while ceramic substrates have lower heat-dissipation coefficients and higher Rth values but are more easily manufactured into smaller package sizes. These trade-offs have to be kept in mind when designing the heatsink.
UV-C LEDs have poor heat extraction and are typically found to have thermal resistance values ranging from 6°C/W to 24°C/W. UV-C LEDs with lower thermal resistance values correspond to better thermal dissipation at the module level, which enhances module lifetime. However, it also should be noted that many electro-optical and thermal values are dependent on the manufacturer’s testing conditions, as explained further below.
Pulsed Current vs. Constant Current Data
A critical parameter shown on datasheets is the radiant flux, which determines the acceptance of a product, and typically is presented as a function of current. There are many factors that affect an LED’s radiant flux: epi-quality, driving current, junction temperature and thermal management solutions. 7 Furthermore, specific test conditions such as pulse duration, ambient temperature and cooling systems can lead to an overestimation of radiant flux. Depending on the specific product, radiant flux measurement may be taken using a pulsed measurement. This can overestimate the flux by reducing the effects of the rising Tj.
When customers receive the package they are promised, the measurement may vary by 5% or even more. Possible reasons for this discrepancy include that the data obtained by pulsing the LEDs is higher than true continuous operation data, due to thermal decay, which usually presents itself during the first 30 minutes of constant current operation. This can be attributed to a rising junction temperature during continuous operation. The junction temperature drops when the LED is turned OFF during pulsing, so the average temperature is higher in the case of the constant operation. When Tj is higher than the nominal value, the peak UV output is not attained at the nominal, rated power. This can be improved by designing a thermal management solution designed specifically for the constant operation.
The second reason pulse current values could be higher than operational data could be the operating conditions. As discussed, the ambient temperature directly impacts the junction temperature. If the manufacturer tests at low ambient temperatures with efficient cooling systems, then the output can be higher than that at normal room temperature conditions. Hence, it is vital to obtain ambient temperature and thermal management information to get an idea of the test conditions used by the manufacturer.
Testing LEDs has to be done keeping a holistic view of the system in mind and so the LED driver (constant or pulsing), the thermal management solution and the operating conditions should be considered vital information before starting any prototyping or testing. In addition, keep in mind that the duty cycle of the pulse also can have an impact on the radiant flux, as the junction temperature will rise and fall accordingly.
Calibration Issues
One issue that must be acknowledged when examining data sheets is the lack of standardization and calibration in measurements among various UV LED manufacturers. Most manufacturers use an integrating sphere to collect flux and measure the output value. However, variation in calibration settings, detector sensitivity and the presence of dust and dirt can cause discrepancy in readings from one integrating sphere to the other. This problem is exacerbated for UV LED products as the deterioration of integrating sphere coatings can have significant impact on the measurements. Hence, standardized testing procedures as well as calibration protocols need to be followed to ensure measurement accuracy. Illuminating Engineering Society recently has published the ANSI/IES LM-92-22 standard for optical and electrical measurements of UV LEDs. 8
Guidelines and Recommendations
While operating conditions dictate the thermal decay rate of the LED and its useful life, following guidelines for handling the device ensures that any unexpected failures are avoided. Safety precautions should be carefully followed to prevent catastrophic failure and to maintain radiance output. Like other semiconductor devices, LEDs easily can be damaged by electro-static discharge. So, transient-voltage-suppression (TVS) diodes are highly recommended. 9 Lens contamination also is an issue that directly affects the radiant output of the package. Hence, lenses should not be handled with bare hands and scratching with other materials should be avoided.
As UV LED parameters can vary greatly between manufacturers in terms of radiant flux, efficiencies and other factors, working closely with the manufacturer during the evaluation and design process can help in reassuring that a product will work in the desired application at specific operating conditions.
Although experimental procedures can be adopted for determining device efficiencies and measuring performance under variable operating conditions, such experimental procedures can be expensive and complex to implement. In an effort to minimize risk, simulations are a useful tool. Some manufacturers may offer optical simulation and design services to improve system designers’ abilities to realistically match target specifications to products. It may be feasible to request ray files and simulation files from manufacturers to build a custom design using standard product ray data. For projects that cannot reach minimum target specifications with standard products, optical design consultation for custom products may be necessary to obtain an optimal solution. From designing a custom layout for the optimal number of chips and providing mechanical layouts, including a 3D CAD model, such simulations can significantly aid the designer in enhancing product knowledge as well as mitigating risk at reduced costs.
Furthermore, thermal design and simulations including CFD analysis are recommended for designers who aim to push the boundaries of UV technology. By working jointly with UV LED solutions providers, designers can perform holistic system design incorporating suitable electrical, thermal and optical solutions that ensure LED reliability and superior performance for a given application.
For more information, visit www.violumas.com.
References
- Alessandra Vitale, Giuseppe Trusiano, Roberta Bongiovanni, “ UV-Curing of Adhesives: A Critical Review,” Reviews of Adhesion and Adhesives, Volume 5, Number 2, June 2017, pp. 105-161(57).
- Jian Chen, Stephanie Loeb and Jae-Hong Kim, “LED revolution: fundamentals and prospects for UV disinfection applications”Environ. Sci.: Water Res. Technol., 2017, pp. 188-202 (3).
- M. Y. Soh, T. H. Teo, W. X. Ng and K. S. Yeo, “Review of high efficiency integrated LED lighting,” 2017 IEEE 12th International Conference on Power Electronics and Drive Systems (PEDS), Honolulu, HI, 2017, pp. 93-97.
- Yoshihiko Muramoto, Masahiro Kimura and Suguru Nouda, “Development and future of ultraviolet light-emitting diodes: UV-LED will replace the UV lamp,” Semicond. Sci. Technol., 2014, pp. 084004 (29).
- Kari Sholtes, Ryan Keliher , Karl G. Linden, “Standardization of a UV LED Peak Wavelength, Emission Spectrum, and Irradiance Measurement and Comparison Protocol,”Environ. Sci. Technol., 2019, pp. 9755-9763 (53).
- D. G. Todorov and L. G. Kapisazov, “LED thermal management,” Proceedings of Electronics, 2008, pp. 139-144..
- Miran Bürmen et al, “LED light sources: a survey of quality-affecting factors and methods for their assessment,” Meas. Sci. Technol., 2008, pp. 122002 (19).
- IES LM 92-22 STANDARD FOR UV LEDs: https://store.ies.org/product/lm-92-22-approved-method-optical-and-electrical-measurement-of-ultraviolet-leds/
- Weblink: https://www.ledsmagazine.com/manufacturing-services-testing/substrates-wafers/article/16695489/integrated-esd-protection-facilitates-more-robust-led-devices-magazine