

Arnav Kumar, student, Oxford Academy (then University of California, Santa Barbara)
Andrea Peña, student, Savanna High School, Anaheim, California
Sigal Willner, student, New York Medical College
Arthur Kreitenberg, clinical professor, University of California, Irvine, School of Medicine
Germicidal UV-C is a recognized means of air, water and surface disinfection in healthcare and other environments. Microbial pathogens are susceptible to a range of cumulative UV-C dosing, usually measured in mJ/cm2. Commercially available UV-C devices emit at a variety of UV-C light intensity, usually measured in mW/cm2. The weaker the intensity, the greater time required to reach the desired cumulative dose. This student-led study queried whether varying UV-C intensity over a seven-fold range, while keeping the cumulative dose constant, affected reductions of Staphylococcus aureus on carriers. UV-C doses of 6.5 mJ/cm2 resulted in 4.9 log10 reduction at UV-C intensities of both 1.0 mW/cm2 and 6.9 mW/cm2, suggesting that required UV-C cumulative dose is independent of applied UV-C intensity.
Background
Ultraviolet-C (UV-C) is becoming an increasingly common means of disinfecting air, water and surfaces within and outside of healthcare. UV-C does not penetrate Earth’s atmosphere, so life forms have never developed resistance to its disruptive effects on DNA and RNA. Multiple publications document log10 reductions vs. UV-C doses for various microbes.1 UV-C doses are measured in energy per surface area delivered, typically as mJ/cm2.
Dosing can be measured by electronic means, analogous to a photography light meter, with digital readouts. These meters are expensive and require periodic calibration to ensure accuracy. Single-use photochromic papers are an inexpensive and commercially available alternative2 but are not highly accurate.
There are wide disparities between UV-C measurement and actual microbe reductions. For example, the dose required to achieve a 3 log10 (99.9%) of Clostridiodes difficile (C. diff) has been determined to be as low as 20 mJ/cm2 or as high as 400 mJ/cm2.3 These differences may be due to measurement and experimental variables. The lack of correlation between UV-C metrology and actual pathogen reduction can lead to infection control professionals falsely believing a UV-C emitter is achieving the desired effect.
This study was undertaken to determine if altering the intensity of the UV-C delivery has an effect on the actual bacterial reduction at a fixed dose.
Educating Healthcare Practitioners about UV-C Measurement
Healthcare practitioners and infection control professionals generally are unfamiliar with how UV-C light is measured, so a brief explanation and instructional analogy are warranted. Suppose the objective is to fill a 1,000 ml (1 liter) container from a faucet. With the valve turned only slightly, with a dripping flow rate of 1 ml/sec, 1,000 seconds are required to fill the container. Turning the valve more to increase the flow rate to 10 ml/sec can fill the container in 100 seconds. Further turning the valve to 100 ml/sec fills the same container in just 10 seconds. If the valve and faucet can deliver 1,000 ml/sec, the container will fill very rapidly in one second. Once the container is full (1,000 ml), there is no way to determine what the flow rate had been, nor does it matter.
Assume the objective of using a UV-C device is to deliver a sufficient UV-C dose to reduce Staphylococcus, influenza and Ebola virus by 3 log10 (99.9%). Available literature indicates this value at about 6.6 mJ/cm2.1 Think about the full 6.6 mJ/cm2 as if it was the volume of water in the full 1,000 ml container – 6.6 mJ/cm2 is the total energy delivered by the UV-C source, just like the total volume of water delivered by the faucet into the container.
Analogous to the flow rate of water from the faucet measured in ml/min, UV-C light flows at varying rates of light intensity, commonly measured in mW/cm2. If a UV-C emitting device delivers 0.066 mW/cm2, 100 seconds will be required to achieve a cumulative dose of 6.6 mJ/cm2. If a more powerful device delivers 0.66 mW/cm2, 10 seconds will be required. If a very powerful UV-C emitter delivers 6.6 mW/cm2, it will require only one second to achieve 6.6 mJ/cm2. Most UV-C “whole room” emitters used in healthcare require much longer than 100 seconds to achieve 6.6 mJ/cm2 on target surfaces.4
The water analogy for UV-C education has limitations. If the distance between the faucet and the container is doubled, the flow rate and time required to fill the 1,000 ml container do not perceptibly change. However, doubling the distance between the UV-C source and the target surface reduces the intensity by 75%, and the time required to achieve the same 6.6 mJ/cm2 is quadrupled. This sometimes is called the “inverse square law.”
The Bunsen-Roscoe Law
In the 19th century, the Bunsen-Roscoe research team found that the biological effect of light energy is directly related to the total energy or dose delivered, irrespective of how it is administered.5 This means that the biological effect, reduction of microbes in the current discussion, is related fundamentally to the total mJ/cm2 delivered. The lamp power, distance and exposure time are not important, so long as their combination delivers the required UV-C dose. Most of the work has been related to UVA and UVB on multicellular organisms.
Referring back to the water analogy, the Bunsen-Roscoe Law says so long as the container is full, the rate at which it was filled is immaterial. A search of the literature found no specific reference to very high intensity UV-C application to Staphylococcus, a common organism in healthcare-associated infections (HAIs). Pousty et al. reported that this Bunsen-Roscoe relationship may not always apply, as higher inactivation of E. coli was obtained at a higher UV-C intensity over shorter exposure time, at the same UV-C dose.6
The purpose of this research was to determine if the Bunsen-Roscoe rule holds true for a common HAI with modern relevant UV-C dosing. As healthcare room turnover time and the time required for whole-room disinfection can be critical, it is important to understand the germicidal efficacy of high-dose, high-intensity, short-duration UV-C application.
Specific Hypothesis
Exposed to the same cumulative UV-C dose, measured in mJ/cm2, bacterial reductions are not affected by varying UV-C intensity, measured in mW/cm2.
Materials and Methods
Test Organism
Staphylococcus aureus, ATCC 25923, (Microbiologics, St. Cloud, Minnesota) was selected for this study, as it grows readily and is of very low virulence.
Quantitative Culture Plates
Baird-Parker (Staphylococcus aureus specific) contact plates (Hardy Diagnostics, Santa Maria, California) were utilized. These are designed for environmental monitoring as the growth medium extends slightly above the rim of the plate and cultures are obtained by simply touching the medium to the environmental surface.
Solution Preparation
An initial culture plate was inoculated with the organism per manufacturer’s directions directly onto a culture plate. The plate was allowed to incubate at 37°C for 48 hours. Resulting colony forming units (CFUs) were 2 to 3 mm in diameter.
Ten CFUs were lifted with a sterile wire loop from the initial culture plate medium and placed into 100 cc of non-bacteriostatic 0.9% normal saline solution. The container was vortexed for 10 minutes until no visible evidence of particulate CFU remained. This was designated as the index solution.
Carrier Inoculation
Carriers were 10 cm x 10 cm smooth ABS plastic. Carriers were disinfected with isopropyl alcohol and allowed to dry. Within a protective enclosure, four controlled pumps of index solution were sprayed individually onto each carrier from a distance of about 15 cm by the same experimenter to ensure consistency. The spray is a fine mist that evenly distributes onto the carriers. Droppers and spreaders resulted in beading up of the solution on the plastic carriers, so the spray was deemed superior for this purpose. Eleven inoculated carriers were used for both exposure intensities.
Controls and Dilutions
Five carriers, which received four pump sprays of index solution without UV-C exposure, were allowed to dry and then cultured as above.
Because hundreds of thousands of CFUs are too many to count on a plate, 1 cc of index solution was serially diluted in the saline to concentrations of 0.001 and 0.0001. These dilutions also were sprayed with four pumps onto five carriers each and incubated. The CFUs were similarly counted on the culture plates. The baseline culture CFUs were then calculated, multiplying by the corresponding factor of 10.
UV-C Measurement
A factory-calibrated International Light Technologies (Peabody, Massachusetts) UV-C meter Model 800 was utilized to simultaneously measure UV-C intensity in mW/cm2 and total UV-C dose in mJ/cm2.
UV-C Exposures
A UVHammer from Dimer (subsequently: exposure device) was used to perform exposures. This device was selected because the “wing” containing three powerful UV-C lamps emitting narrow spectrum 254 nm can be positioned horizontally to optimally expose horizontal surfaces, and the height easily is adjusted over the required wide range. For the purposes of this study, the vertical lamp on the body and the floor lamp were disabled.
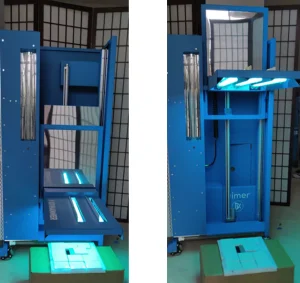
At distances less than 20 cm, the stationary wing lamps create an uneven light distribution, based on placing the UV-C meter at various locations beneath the horizontally positioned wing. In practice, the motion of the exposure device eliminates the close-distance uneven distribution. Because this study was done with a stationary wing, a minimum distance of 21 cm was selected, which provides for a more even light distribution across the 11 carriers, as determined by the UV-C light meter positioned on the carrier test platform. Figure 1 shows the experimental exposure setup with 11 carriers surrounding the UV-C meter aperture at 21 cm and 90 cm distances, using the exposure device with only the horizontal wing lamps powered.
The wing lamps of the Exposure Device were powered through an electronic timer settable at 0.1-sec increments, allowing precise exposure durations. With UV-C lamps, there is a 0.3- to 0.5-second time delay between powering the ballast and the lamp emitting UV-C. Therefore, the timer setting was determined empirically prior to the experimental trials and the reported lamp-on duration was calculated, rather than reporting the preset power-on interval. The endpoint of exposure was determined by actual cumulative UV-C dose per meter reading rather than a time/intensity calculation.
Two levels of intensity, based on meter readings, were utilized in this study by varying the distance between the Exposure Device wing and the inoculated carriers/meter. Distances of 21 cm and 90 cm between the lamp surface and carrier surface were selected. The carriers were arranged surrounding the aperture of the UV-C meter to ensure uniform carrier UV-C exposure.
Quantitative Cultures, Incubation and CFU Counting
Within 20 minutes of UV-C exposure, a Baird-Parker contact plate was applied to each carrier by the same experimenter to ensure consistency of sampling. Plates were labeled with distance and measured cumulative UV-C exposure. Plates then were placed into an incubator for 48 hours at 37º C.
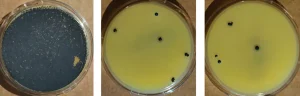
Plates were removed from the incubator and photographs were obtained. Three experimenters independently counted CFUs on each plate. Greater than 300 CFUs per plate were considered too many to count.
Statistical Analysis
CFU counts for the three intensities were compared for statistically significant differences using a Student T-test.
Results
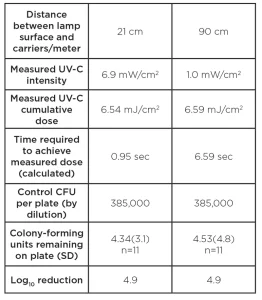
Figure 2 shows the typical appearance of control and exposed plates at the two intensities. Table 1 shows the study results.
Discussion
This study was undertaken to determine if varying the intensity (mW/cm2) of the UV-C application affected the kill rate at the same total cumulative UV-C dose (mJ/cm2). The intensity depended on the distance between the lamps and the target surface, with corresponding exposure times increasing as the distance is increased.
Using a calibrated UV-C meter, the researchers were able to accurately measure both intensity and total cumulative UV-C dose. Total dose was kept within 1%, while the intensity was nearly seven-fold greater at the closer distance.
The average number of CFUs per plate was 4.34 at 21 cm and 4.53 at 90 cm, with a T-test p value greater than 0.9, indicating an extremely unlikely difference in the two groups.
The researchers concluded that the germ kill rate is determined by total dose, measured in mJ/cm2, and is independent of the UV-C intensity, measured in mW/cm2. These data show that decreasing the distance does not affect the dose required for a given kill rate. However, if the user is not rushed for time, a weaker UV-C device or a device further from the target surface likely is acceptable.
The Bunson-Roscoe law seems to hold true for UV-C’s germicidal effect on Staph at very high intensities. This information is useful as infection control professionals may be assured that whole-room disinfection devices applying UV-C very rapidly at high intensity are at least as effective as devices that apply low-intensity UV-C over long intervals.
Although the published literature predicts that a total dose of UV-C at 6.5 mJ/cm2 will result in a 3 log10 Staphylococcus reduction1, data in both experimental conditions showed a 4.9 log10 reduction, nearly 100 times greater than predicted. The researchers’ findings are consistent with those reported by Pousty6 for E. coli using fluorescent lamps. Although the researchers do not have a technical explanation for this discrepancy, these data underscore the perils of relying on simply measuring UV-C output, rather than actual culture-based microbe reductions. Interestingly, Pousty et al.6 found the opposite effect with longer light wavelengths produced by LEDs in the UV-C range.
Limitations of the Study and Future Research
A limitation of the current study is that the researchers tested only at 21 cm and 90 cm with intensities of 6.9 mW/cm2 and 1.0 mW/cm2, respectively. At 90 cm, less than seven seconds were required to achieve the desired dose and nearly 5 log10 reductions. The exposure device utilized in this study is designed to operate at very close distances with intensities over 12 mW/cm2. Other devices require 15 minutes or more to achieve a target dose of 6.5 mJ/cm2, indicating intensities at the target surface of only 0.007 mW/cm2, a 1000-fold intensity difference. This study did not consider these extremely low intensities. Future studies may confirm these conclusions over a wider range of intensities tested.
UV-C emerging technologies, including pulsed Xenon, excimer 222 and LEDs, also should be studied to better understand these relationships.
References
- Malayeri AH, Mohseni M, Cairns B, Bolton JR, Chevrefils G, Caron E, Barbeau B, Wright H, Linden KG (2016). Fluence (UV-C dose) required to achieve incremental log inactivation of bacteria, protozoa, viruses and algae. International Ultraviolet Association News 18(3). https://iUV-Canews.com/stories/pdf/archives/180301_UV-CSensitivityReview_full.pdf
- Masse V, Hartley MJ, Edmond MB, Diekema DJ (2018). Comparing and optimizing ultraviolet germicidal irradiation systems used for patient room terminal disinfection: An exploratory study using radiometry and commercial test cards. Antimicrobial Resistance & Infection Control 7:29. https://doi.org/10.1186/s13756-018-0317-1
- Boyce JM and Donskey CJ (2019). Understanding ultraviolet light surface decontamination in hospital rooms: A primer. Infection Control & Hospital Epidemiology, https://doi.org/10.1017/ice.2019.161
- Anderson DJ, Moehring RW, Weber DJ, Lewis SS, Chen LF, Schwab JC, Becherer P, Blocker M, Triplett PF, Knelson LP, Lokhnygina Y, Rutala WA, Sexton DJ (2018). Effectiveness of targeted enhanced terminal room disinfection on hospital-wide acquisition and infection with multidrug-resistant organisms and Clostridiodes difficile: A secondary analysis of a multicentre cluster randomised controlled trial with crossover design (BETR Disinfection). The Lancet Infectious Diseases 18(8):845–853. https://doi.org/10.1016/S1473-3099(18)30278-0
- Schindl, Rosado-Schlosser B., Trautinger F. The reciprocity rule in photobiology-a review, http://www.photobiology.com/reviews/bunsen/index.htm
- Pousty D, Hoffmann R, Gerchman Y, Mamane H. Wavelength-dependent time-dose reciprocity and stress mechanism for UV-LED disinfection of Escherichia coli, J. of Photochemistry and Photobiology 217(3):112129
Acknowledgments
The authors wish to thank the TGR Foundation, a Tiger Woods Charity, for the use of the TGR Learning Lab Facility in Anaheim, California. Dimer LLC is honored to have partnered with the TGR Foundation in its commitment to “empowering students to pursue their passions through education.”