

Martin Spruijt, process engineer, PWN Water Supply Company
Bram J. Martijn, team manager-research and development, PWN Water Supply Company
Joop C. Kruithof, ambassador, Wetsus European Centre of Excellence for Sustainable Water Technology
Water utilities have been increasingly detecting organic micropollutants and their transformation products in water sources on a global scale.1 Although often present in low concentrations and toxicologically irrelevant, from a consumer’s perspective and possible synergistic effects, it was determined that the presence of organic micropollutants in drinking water should be avoided.2 In the 1990s, Dutch water utility PWN decided that the barrier against organic micropollutants had to be upgraded, primarily caused by the new EC standard for herbicides of 0.1 µg/L. At that moment in The Netherlands, 350 herbicides were applied.3 Many were found in the IJssel Lake, the drinking water source of water treatment plant (WTP) Andijk, in concentrations up to 1.0 µg/L.4 After storage the highest concentration was 0.5 µg/L, so 80% removal was required.
It was decided that the 80% removal should be achieved by oxidative treatment, with the already present GAC filtration as an additional safety barrier and to achieve biostability.5 Bench scale and pilot research was carried out to investigate the feasibility of O3/H2O2 treatment. Eighty percent atrazine removal could be realized for an O3/DOC ratio of 1.13 g/g and H2O2/O3 ratio of 2.0 g/g. However, under these conditions high bromate concentrations were formed. The bromate formation could be lowered by increasing the H2O2/O3 ratio to 4.0 g/g and the pH to 7.9, but concentrations lower than 2-3 µg/L could not be realized. Because PWN pursued a bromate standard of 0.5 µg/L, O3/H2O2 treatment was not installed, and in the next research phase the feasibility of UV/H2O2 treatment was investigated.
Pilot MPUV/H2O2 experiments in a disinfection reactor showed that, for a UV dose of 1,000 mJ/cm2 and a H2O2 dose of 6.0 mg/L, 80% atrazine degradation could be realized without any bromate formation.6 The value needed for disinfection is just a fraction of this UV dose. Nitrite produced by MPUV photolysis of nitrate was lowered to under the EC standard of 100 µg/L by post GAC filtration. Based on bench scale kinetic research and CFD modeling, the disinfection reactor design was optimized for micropollutant degradation. For a UV transmission > 85%, 80% atrazine degradation could be realized for a UV dose of 540 mJ/cm2 and an H2O2 dose of 6.0 mg/L, lowering the energy consumption by almost 50%. The applied UV and H2O2 dose were economically acceptable for full scale application. Based on these results, in 2004 a full scale MPUV/H2O2 system was installed at Andijk with four reactors containing 16 12kW MPUV lamps giving satisfactory results.
Since the installation at WTP Andijk became operational, the following additional research has been carried out:
- to lower the required energy consumption of the MPUV installation
- to investigate the removal of recently identified types of micropollutants
- to establish the cause of genotoxicity formation and its removal by GAC filtration
Lowering the energy consumption of the UV installation was pursued by removing UV-absorbing compounds, such as DOC and nitrate, in pretreatment. The effect of CSF replacement by IX on DOC and nitrate removal and its effect on the energy consumption by the MPUV installation was established.
Numerous new micropollutants – such as more polar herbicides, solvents, flame retardants and pharmaceuticals – were found in the IJssel Lake. The degradation by MPUV/H2O2 treatment with a UV dose of 540 mJ/cm2 and an H2O2 dose of 6 mg/L was investigated. Besides the genotoxic response in the Ames test in pretreated IJssel Lake water, the cause of the response produced by MPUV/H2O2 treatment in reconstituted water was pursued.
Finally, the removal of micropollutants poorly degraded by MPUV/H2O2 treatment and the removal of the genotoxic response by post-GAC filtration was investigated. The results of these research efforts are summarized in this paper.
Materials and methods
MP collimated beam apparatus: Degradation by MP UV photolysis, as well as MP UV/H2O2 oxidation of organic micropollutants, was determined on bench scale using a collimated beam apparatus. The water sample was exposed to UV radiation from a 1kW MP UV lamp. UV irradiance at the water surface in the centre of the UV beam was measured before and after each experiment to determine the depth-average irradiance. Kinetic constants were determined, and the collimated beam apparatus was used to validate the pilot system.
MP UV/H2O2 Pilot: The MP UV/H2O2 pilot reactor was a Trojan SWIFT4L12 UV reactor equipped with four 2.8 kW MP UV lamps. The pilot was operated with a flow between 10 and 40 m3/h and a H2O2 dosage between 0 and 15 mg/L.
MP UV/H2O2 full scale: The WTP Andijk full scale MP UV/H2O2 installation for primary disinfection, as well as destruction of organic micropollutants, was equipped with 12 Trojan SWIFT 16L30 UV reactors, arranged in three lines of four reactors, each with a total UV power of 2.4 MW. The system was designed to provide 80% degradation of atrazine at a flow rate of 4,000 m3/h from pretreated IJssel Lake water with a UVT254 higher than 85% with a design EED of the system of 0.56 kWh/m3.
Chemical and genotoxicological analysis: Chemical analysis of organic micropollutants was performed using gas chromatography (GC) and high-pressure liquid chromatography (HPLC) for the bench scale and pilot experiments. Prior to the pilot experiments, the organic micropollutants were added to the feed water at concentrations enabling analysis of a residual after treatment well above the analytical detection limit of 0.02 μg/L required for measurement of 99.9% degradation. Degradation of organic micropollutants for the full-scale installation was determined using gas chromatography mass spectrometry (GC-MS).
The biological assay Ames II test was used to assess the genotoxic response in MP UV/H2O2 treated water. In a liquid culture, salmonella typhimurium strains were applied containing TAMix (TA7001, TA7002, TA7003, TA7004, TA7005 and TA7006) and TA98. In addition, a mixture of rat liver enzymes was added to assess S9 metabolic activation.
Results
Part 1: Improvement economics MPUV/H2O2 treatment by pretreatment enhancement
Reducing the energy consumption of the MPUV/H2O2 system was a major part of the research focused on lowering the operating costs. Lowering the energy consumption can be achieved by removing UV absorbing compounds by pretreatment, thereby reducing the competition for UV light required for H2O2 photolysis. DOC and nitrate are major constituents absorbing UV light.
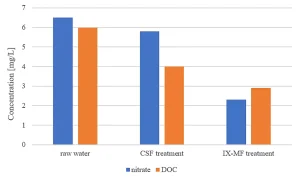
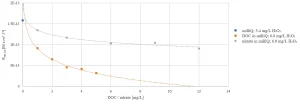
Figure 1 shows the impact of DOC content and nitrate concentration on the OH radical exposure, indicating that nitrate and especially DOC removal are beneficial for the micropollutant degradation by MPUV/H2O2 treatment. Pretreatment by conventional coagulation, sedimentation and filtration (CSF) had no effect on the nitrate concentration and a restricted impact on the DOC content. Ion exchange, ceramic membrane filtration (IX-CMF) lowered both the nitrate concentration and DOC content (Figure 2). By varying process conditions, a wide range of nitrate and DOC removal rates could be achieved.
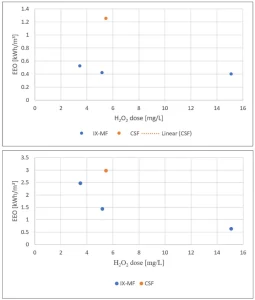
In MPUV/H2O2 pilot experiments the electric energy per order (EEO) as a function of the H2O2 dose for NDMA and 1,4-dioxane degradation in CSF and IX-CMF pretreated water was determined.7 NDMA was almost completely removed by UV photolysis, showing no impact of the H2O2-concentration (Figure 3a), while 1,4-dioxane was completely removed by OH radical oxidation, showing a strong effect of the H2O2 concentration (Figure 3b). For both compounds, the EEO in CSF pretreated IJssel Lake water was much higher than the EEO in IX-CMF pretreated IJssel Lake water.
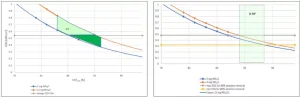
The impact of pretreatment was further established by the effect of the UVT254 and nitrate on the electric energy dose (EED). Figure 4a shows the EED as a function of the UVT254 for enhanced CSF treated water in the presence of 2 mg/L NO3- (summer conditions) and 12 mg/L NO3- (winter conditions). For the design EED of 0.54 kWh/m3 80% atrazine degradation could not be achieved for an UVT254 lower than 86% in summer or even 91% in winter. Figure 4b shows the EED as a function of the UVT254 for IX-CMF pretreated water in the presence of 2 and 4 mg/L NO3-. After IX-CMF, even for the lowest UVT254 of 90% and the highest nitrate concentration of 4 mg/L 80%, atrazine degradation could be achieved. For a higher UVT254 and a lower nitrate concentration, either a lower EED of 0.32kWh/m3 could be applied or more water could be treated at the EED of 0.54 kWh/m3 showing the significant impact of IX-CMF pretreatment.
Part 2: Extension primary objective and formation toxic by-products
2.1 Degradation of herbicides, pharmaceuticals and perfluorated compounds.
The degradation of eight herbicides, pharmaceuticals and perfluorated compounds was determined in MPUV/H2O2 pilot experiments for a UV dose of 540 mJ/cm2 and a H2O2 dose of 6 mg/L.8
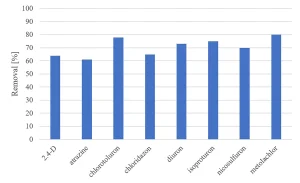
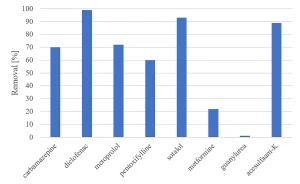
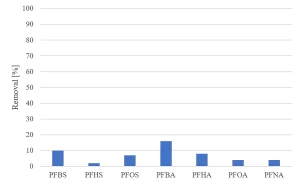
All herbicides showed a significant degradation, although the original requirement of 80% was not achieved (Figure 5). The degradation of pharmaceuticals showed a higher variability, with a low degradation for metformine and guanylurea (Figure 6), while all perfluorated compounds were degraded very poorly (Figure 7).
For a removal of more than 80% of all priority compounds post treatment by GAC-filtration was required.
2.2 Formation harmful reaction products
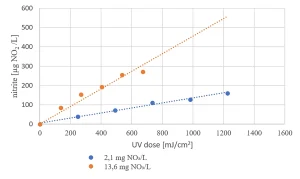
Due to the presence of nitrate in the raw water source (as low as 2 mg/L in summer and up to 14 mg/L in winter) nitrite formation by MPUV/H2O2 treatment may be an issue (Figure 8). For the highest nitrate concentration, the EC standard of nitrite of 100 µg/L was exceeded for the in-practice applied UV dose of 540 mJ/cm2, requiring post treatment.
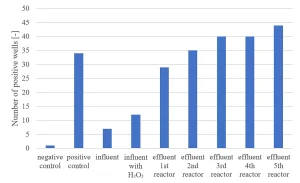
Ames II TA98 testing has been carried out.9 An increasing response in the Ames II TA98 test over the UV/H2O2 treatment train (Figure 9) indicated formation of genotoxic compounds by MPUV/H2O2 treatment.
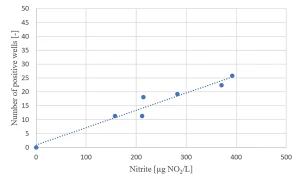
A relationship between the nitrite formation and the Ames II test response was established (Figure 10), indicating a relationship between nitrate photolysis and the formation of nitrated genotoxic compounds.
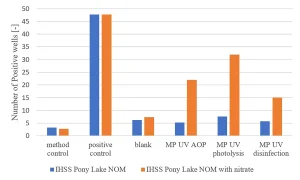
Bench MPUV scale experiments were carried out in demineralized water with Pony Lake humics as carbon source in the presence and absence of 10 mg/L NO3-. The Ames II TA98 response was determined for disinfection (40 mJ/cm2), UV photolysis (600 mJ/cm2) and advanced oxidation (600 mJ/cm2 and 6 mg/L H2O2) conditions. In the absence of nitrate, no increase in the Ames test response was found, while in the presence of 10 mg/L NO3- a significantly increased response was observed (Figure 11), confirming the effect of nitrate on the formation of genotoxic compounds.
For disinfection conditions with a UV dose of 40 mJ/cm2 a significant Ames test response was observed, the highest response was found after UV photolysis.
Part 3: Post treatment for micropollutant control and genotoxicity removal
The moderate level of pharmaceutical control, limited removal of perfluorated compounds and formation of genotoxic byproducts in the presence of nitrate by MP UV/H2O2 treatment caused GAC filtration post-treatment exploration for full-scale application. The objective of GAC filtration implementation would be broadened from safety and biostability to micropollutant control and a robust barrier against reaction products from both oxidative and photolytic degradation.
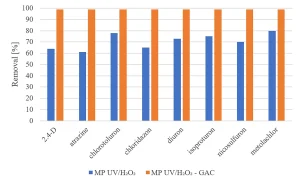
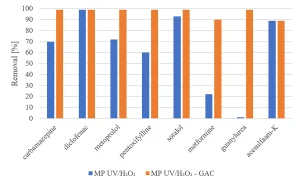
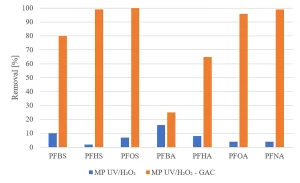
Experiments were carried out to determine if GAC filtration would meet these goals. Experiments with MP UV/H2O2 treatment followed by GAC filtration (Norit ROW 0.8, EBCT 20 minutes) were performed.8 The same selection of herbicides, pharmaceuticals and perfluorated compounds as investigated for MP UV/H2O2 treatment was used. Figure 12 shows an almost complete removal of herbicides by MP UV/H2O2-GAC. In Figure 13, the removal of pharmaceuticals by MP UV/H2O2-GAC is depicted. All pharmaceuticals were removed for more than 90%. Perfluorated compounds, poorly removed by MP UV/H2O2 treatment, resulted in a significant removal by post-treatment with GAC filtration, as shown in Figure 14. Based on the removal rates, MP UV/H2O2-GAC proved to be a non-selective barrier against all newly identified compounds.
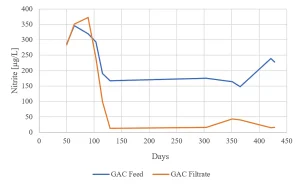
Nitrite formation by MPUV/H2O2 and removal by GAC was determined for more than one year. After MPUV/H2O2 the nitrite concentration was always higher than the EC standard of 100 µg/L (Figure 15). During GAC start up in winter, nitrite was not removed. When the water temperature increased, the nitrite concentration was lowered to around 20 µg/L and remained less than 50 µg/L in the following winter.
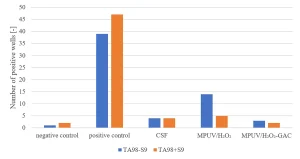
Applying the Ames II TA98 test with and without metabolic activation CSF pretreated water did not show an increased response, while MPUV/H2O2 treated water showed an increase of positive wells without metabolic activation. Post GAC-filtration completely removed the genotoxic response (Figure 16). A multibarrier treatment by MPUV/H2O2 treatment followed by GAC filtration proved to be a robust barrier against micropollutants, while nitrite and genotoxicity produced by MPUV/H2O2 treatment were controlled by GAC filtration.
Discussion and conclusions
The effect of IX-MF pretreatment in comparison to CSF pretreatment on MPUV/H2O2 treatment regarding economics and water quality has been studied. Compared to CSF pretreatment, IX-MF pretreatment improved the water quality with regards to UVT by a higher removal of the UV absorbing compounds DOC and nitrate. For this reason, among others, PWN decided to implement full scale IX-MF treatment at WTP Andijk prior to MPUV/H2O2. Due to the improvement of UVT254 and lowering the nitrate concentration by IX-MF pretreatment, compared to CSF pretreatment 80% atrazine degradation always could be achieved and MPUV/H2O2 became more economic, creating the technological opportunity to either lower the EED or to increase the water feed maintaining organic contaminant control. Nitrate levels in the raw water source (as low as 2 mg/L in summer and up to 14 mg/L in winter) caused nitrite formation and an increase in Ames II test response by MPUV/H2O2 treatment.
When nitrate is absent, no increase in Ames II test response was observed, suggesting the formation of genotoxic nitrated compounds by MPUV photolysis of nitrate. For disinfection conditions, a significant Ames test response was found. In addition, a high removal of all herbicides, pharmaceuticals and perfluorated compounds was not established by MPUV/H2O2 only. The increases in Ames II test response and the partial micropollutant degradation underlines the need for post treatment. GAC filtration removed substances poorly degraded by MPUV/H2O2 treatment. Additional removal of herbicides, pharmaceuticals and perfluorated compounds was confirmed in MPUV/H2O2-GAC treatment in pilot experiments. Furthermore, post-GAC-filtration completely removed the genotoxic response. After start-up in summer, GAC filtration resulted in a reduction of the nitrite concentration to around 20 µg/L in summer and remained less than 50 µg/L in the following winter. The full scale two-step GAC filtration already present at WTP Andijk satisfied all requirements for full scale MPUV/H2O2-GAC application.
In conclusion, MPUV/H2O2 treatment, in combination with IX-MF pretreatment and GAC posttreatment, provides a robust and economical system for organic contaminant control now and in the future.
Acknowledgements
The authors wish to acknowledge the following for their contribution to this study:
- KWR Water Research Institute – DPWE (Waternet, Dunea and PWN)
- Wetsus European Centre of Excellence for Sustainable Water Technology
- Het Water Laboratorium Haarlem
Contact: Martin Spruijt, martin.spruijt@pwnt.com; Bram J. Martijn, bram.martijn@pwnt.com; Joop C. Kruithof, joop.kruithof@planet.nl
References
- Ternes, T.A. Emerging substances in water – A new challenge for water management. Presentation at Emerging environmental pollutants, Stresa. (2006).
- Escher, B.I. et al. Benchmarking organic micropollutants in wastewater, recycled water and drinking water with in vitro bioassays. Environmental Science & Technology 48, 1940-1956. (2014)
- Hopman, R. van Beek, C.G.E.M, Janssen, H.M.J., and Puijker, L.M. Herbicides and drinking water supply in the Netherlands. KIWA communication 113. (1990)
- Kruithof, J.C., Kamp, P.C., Martijn, A.J. UV/H2O2 Treatment: A practical solution for organic contaminant control and primary disinfection. Ozone: Science & Engineering. 29:4, 273-280. (2007).
- Rook, J.J. Formation of haloforms during chlorination of natural water. Water Treatment Exam 23, 234-245. (1974)
- Kruithof, J.C., Kamp, P.C., Belosevic, M., Stefan, M. UV/H2O2 retrofit of PWN’s water treatment plant Andijk for primary disinfection and organic contaminant control. 2nd IWA Leading-Edge on Water and Wastewater Treatment Technologies. 53-65. (2004)
- Martijn, A.J., Fuller, A.L., Malley, J.P., Kruithof, J.C. Impact of IX-UF pretreatment on the feasibility of UV/H2O2 treatment for degradation of NDMA and 1,4-Dioxane. Ozone: Science and Engineering. 32:6, 383-390. (2010).
- Hofs, B. et al. Robuustheid zuiveringen DPW 2012-2103; zomer en winter. KWR 2014.022. (2014)
- Martijn, A.J., Kruithof, J.C. UV and UV/H2O2 Treatment: The Silver Bullet for By-product and Genotoxicity Formation in Water Production, Ozone: Science & Engineering. 34:2, 92-100. (2012)