

Bram J. Martijn
team manager-research and development, PWN Water Supply Company
Joop C. Kruithof
Ph.D., Wetsus European Center of Excellence for Sustainable Water/Technology
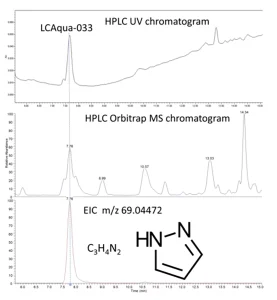
On July 9, 2015, Water Supply Company Limburg (WML) noticed the presence of a high concentration of an unknown compound in the water of the river Meuse1.
KWR Water Cycle Research Institute showed that the unknown pollutant, LC Aqua-033, was pyrazole, present in a concentration higher than the signal/reporting value of the Dutch drinking water regulation of 1 µg/L. The emission of pyrazole in the river Meuse was caused by a malfunctioning wastewater treatment plant at the industrial site of Chemelot in Geleen, Netherlands. One of the companies at this complex produces acrylonitrile, which causes significant emissions of pyrazole. Pyrazole can be removed through biological wastewater treatment. Malfunctions at the plant led to pyrazole being discharged in the Meuse for several months in high concentrations.
In August 2015, the presence of pyrazole also was observed in the river Rhine in even higher concentrations. The presence of pyrazole in the Rhine caused a water intake stop from the Lek Canal (river Rhine water), serving water supply companies PWN and Waternet2. This time, the presence of pyrazole was caused by the wastewater discharge of an acrylonitrile production plant located at Chempark Dornagen, Cologne, Germany. No toxicological data for pyrazole were available3. A provisional guideline of 15 µg/L was set. Additionally, a water quality standard of 3 µg/L was set for the presence of pyrazole in surface water used for the production of drinking water4.
Presence of pyrazole in Dutch drinking water sources
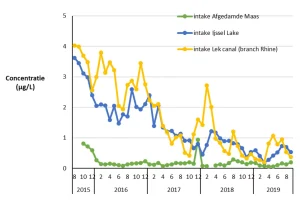
Since August 2015, the Dutch water supply companies have developed a pyrazole monitoring program. The results are summarized in Figure 2.
In August 2015, the pyrazole concentration in the Ijssel Lake amounted to 4 µg/L. The pyrazole concentration decreased as a function of time and became below a concentration of 0.5 µg/L since November 2018. Initially the pyrazole concentration in Ijssel Lake exceeded the signal value of 1 µg/L and even the water quality standard of 3 µg/L. Since November 2018, neither guideline value has been exceeded. The concentration in the Lek Canal followed the same trends. The concentrations in the Afgedamde Maas were significantly lower.
Pyrazole removal/degradation by drinking water treatment processes
The concentration of pyrazole can be lowered by removal processes such as granular activated carbon (GAC) filtration, reverse osmosis (RO), and by degradation processes such as ozonation and advanced oxidation by O3/H2O2 or UV/H2O2 treatment. By GAC filtration, the pyrazole removal amounted 16 to 35%5. Reverse osmosis caused a pyrazole removal of 65 to 80%6. For pyrazole concentrations initially reported, these processes will not be able to lower the pyrazole concentration below the signal value of 1 µg/L. The effect of ozonation proved to be very low (<10%). By far the best results were achieved by advanced oxidation by O3/H2O2/UV and UV/H2O2 treatment. A degradation of more than 90% was achieved, lowering the pyrazole concentration below the signal value7. Advanced oxidation seems to be the silver bullet for pyrazole degradation. Therefore, the degradation of pyrazole by both LP and MP UV/H2O2 treatment will be pursued in this article.
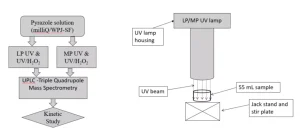
Experimental set-up and procedure
Two collimated beam apparatuses housing a low-pressure UV lamp and a medium-pressure UV lamp were used. The UV fluence rate was determined by two radiometers. One radiometer was equipped to measure the fluence rate of monochromatic light from the LP UV lamp, the other to measure the fluence rate of polychromatic light from the MP UV lamp. Sample volumes of 55 mL were irradiated during a calculated time to achieve the required fluence rate using Bolton’s spreadsheet for UV dose calculation8. A control sample was stirred without irradiation for the time required to reach the highest UV fluence. After the irradiation time, catalase was added to the samples to quench the excess H2O2. Pyrazole was quantified using UPLC-Triple Quadrupole Mass Spectrometry.
Reagents and water types
Analytical grade pyrazole (98%) was purchased and 30% w/w H2O2 was diluted to concentrations of 3 g/L and 30 g/L. Calculated volumes of these stock solutions were added to the water samples to obtain concentrations of 6 mg/L and 50 mg/L H2O2 respectively. A stock solution of bovine liver catalase (activity 12,800 U/mg) 39,800 U/mL was prepared. From this solution 10 µL was added to the 55 mL samples to quench H2O2. MilliQ water was produced using a Millipore Advantage A10 Water Purification system with Q-GardT1 + Quantum TEX cartridge with a pore size of 0.22 µm. Pretreated Ijssel Lake water treated by coagulation, sedimentation and rapid sand filtration was collected from water treatment plant Princess Juliana. The nitrate concentration of the water was 10 mg/L, the HCO3– and CO32- concentrations were 151 and 0 mg/L respectively. Samples with 40 µg/L pyrazole spiked in milliQ and pretreated Ijssel Lake water were prepared by Het Water Laboratorium, The Netherlands. This pyrazole concentration was chosen to enable measurement of 3-log degradation based on the limit of quantification of the analytical method.
Results
UV absorption spectra
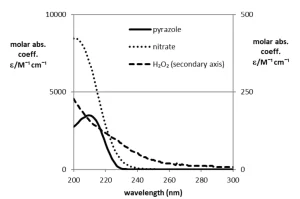
The molar absorption coefficients of pyrazole, hydrogen peroxide and nitrate as a function of the wavelengths are presented in Figure 4, Panel A. The absorption spectrum of pyrazole shows that pyrazole can be degraded by MP UV photolysis and not by LP UV photolysis, because, at a wavelength of 254 nm emitted by a LP UV lamp, the molar absorption of pyrazole is negligible.
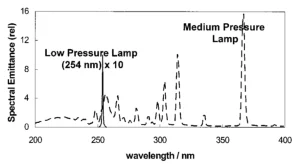
Pretreated Ijssel Lake water absorbs more photons emitted by the MP UV lamp compared to the absorption of photons emitted by the LP UV lamp. This has a strong impact on the competition for photons between the water matrix and H2O2 for MP and LP UV lamps.
Among the water matrix constituents, besides natural organic matter (NOM), nitrate plays an important role. The NOM and the 10 mg/L nitrate present in pretreated Ijssel Lake water create a competition for photons, especially in the wavelength range of 200 to 240 nm. In pretreated Ijssel Lake water, the production of hydroxyl radicals is hampered by the competition for photons between H2O2 and nitrate because in the wavelength range 200 to 240 nm the molar absorption coefficient of nitrate is much higher than of H2O2. Therefore, in pretreated Ijssel Lake water, pyrazole degradation will be significantly slower than in milliQ.
Pyrazole degradation as a function of the reaction time
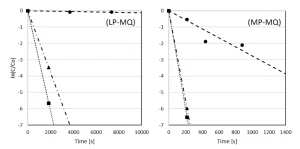
The degradation of pyrazole by UV photolysis and UV/H2O2 treatment with LP and MP UV lamps for H2O2 dosages of 6 and 50 mg/L is presented as a function of the irradiation time in milliQ (Figure 5) and pretreated Ijssel Lake water (Figure 6).

By LP UV photolysis, no pyrazole degradation was observed in milliQ, contrary to MP UV photolysis by which a 3-log degradation was observed after 1,100 seconds. By both LP and MP UV/H2O2 treatment, pyrazole was degraded very effectively. By MP UV/H2O2 treatment, pyrazole was degraded for 3-log after a reaction time of 150 seconds for both H2O2 doses. By LP UV/H2O2 treatment, the reaction time to reach 3-log degradation was much longer: 1,800 seconds for 6 mg/L H2O2 and 1,200 seconds for 50 mg/L H2O2.
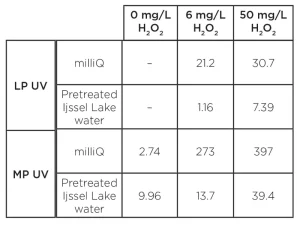
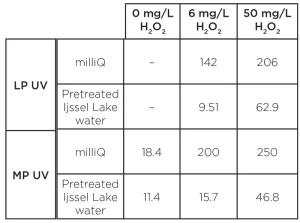
Compared to the degradation in milliQ, the reaction times in pretreated Ijssel Lake water were much longer. A 3-log degradation was achieved for an H2O2 dose of 50 mg/L only. The reaction time amounted to 700 seconds for MP UV and 3,000 seconds for LP UV/H2O2 treatment. The time-based reaction rate constants for the pyrazole degradation are presented in Table 1.
The table confirms the absence of degradation by LP photolysis and a significantly faster conversion by MP photolysis. Compared to the conversion in milliQ, the degradation in pretreated Ijssel Lake water is more than one order of magnitude lower.
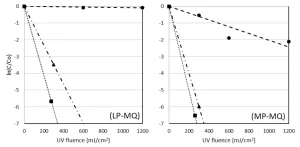
Pyrazole degradation as a function of the UV fluence
The LP UV lamp power output is much lower than the MP UV lamp power output, causing a much longer reaction time for the LP UV experiments. For a better comparison, the pyrazole degradation is also plotted as a function of the UV fluence. The degradation of pyrazole as a function of the UV fluence by UV photolysis and by UV/H2O2 treatment with LP UV and MP UV for H2O2 doses of 6 and 50 mg/L is presented in milliQ (Figure 7) and pretreated Ijssel Lake water (Figure 8).
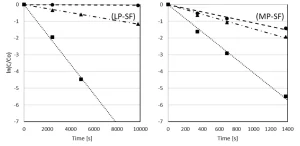
Once again, by LP UV photolysis, no pyrazole degradation was observed in milliQ, while by MP UV photolysis a 2-log degradation was achieved at a UV fluence of 1,200 mJ/cm2. By both LP and MP UV/H2O2 treatment, pyrazole was degraded effectively, although the UV fluences for LP UV/H2O2 treatment were significantly higher. By LP UV/H2O2 treatment 3-log degradation was achieved for a UV fluence of 150 and 300 mJ/cm2 for 6 mg/L H2O2 and 50 mg/L H2O2 respectively. For MP UV/H2O2 treatment these UV fluences amounted to 100 and 150 mJ/cm2 respectively.
Compared to the degradation in milliQ, the UV fluences in pretreated Ijssel Lake water were significantly higher. A 3-log degradation was once again achieved only for an H2O2 dose of 50 mg/L. The required UV fluence was higher for MP UV/H2O2 treatment than for LP UV/H2O2 treatment. The UV fluence amounted to 400 mJ/cm2 for LP UV/H2O2 treatment and 600 mJ/cm2 for MP UV/H2O2 treatment. The fluence rate-based reaction rate constants for the pyrazole degradation are presented in Table 2.
Once again, the absence of pyrazole degradation by LP UV photolysis was confirmed, while a significant degradation of pyrazole by MP UV photolysis was observed. In milliQ for MP UV/H2O2 treatment, the fluence-based rate constants were larger than the LP UV/H2O2-based rate constants. The differences were 34% and 19% for H2O2 doses of 6 and 50 mg/L respectively. The same trend was observed in pretreated Ijssel Lake water for a H2O2 dose of 6 mg/L. However, for a H2O2 dose of 50 mg/L, the fluence-base rate constant was larger applying LP UV lamps.
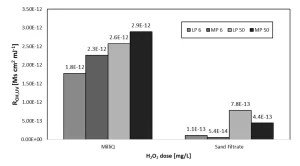
Impact of the water matrix on radical exposure
To study the effect of the water matrix on LP UV and MP UV/H2O2 treatment, the OH radical exposure for the observed pyrazole degradation was calculated (see Figure 9)9.
In milliQ, the ROH,UV values for MP UV/H2O2 treatment were larger than for LP UV/H2O2 treatment for both H2O2 doses. For pretreated Ijssel Lake water, the ROH,UV values were roughly 1,5-log unit lower than in milliQ water. However, in pretreated Ijssel Lake water, ROH,UV values were larger for LP UV/H2O2 treatment for both H2O2 dosages.
In summary, it can be concluded that the required pyrazole degradation can be achieved by advanced oxidation. Both MP and LP UV/H2O2 treatment can achieve the required degradation under economically feasible conditions. MP UV treatment is slightly more attractive by the contribution from UV photolysis. Also, in extensive pretreated water MP UV/H2O2 treatment is more favorable. In heavily polluted water, LP UV/H2O2 treatment may be more attractive.
Acknowledgements: The authors thank Suyash Mandal for his work at PWNT for his master thesis on which this paper is based.
References
- Dutch news, 2015. Chemicals scare hits Limburg drinking water firms
- Baken, K., Kolkman, A., Diepenbeek, P., Ketelaars, H., Wezel, A. van, 2016. Signalering van overige antropogene stoffen, en dan? De pyrazool casus H2O-online, September 2016
- Chem ID plus, 2016. Pyrazole. TOXNET, Toxicology Data Network, U>S> National Library of Medicine, National Institute of Health, pp 1-3
- VEWIN 2016, Protocol voor ‘opkomende stoffen’. VEWIN Journaal, Maart 2016
- Evides 2015 Intermezzo organische microverontreinigingen-gemiddelde verwijdering van pyrazool (in Dutch)
- Rupert, N, 2016, Verwijdering van pyrazool door zeewater R.O. membraan. OASEN
- Bertelkamp, C., Hijnen, W., Hofman-Caris, R., 2016 Pyrazool-inventarisatie full-scale data en verkennend experimenteel onderzoek KWR2016.203 (in Dutch)
- Bolton, J.R. and Linden, K.G., 2003. Standardization of Methods for Fluence (UV dose) Determination in Bench Scale UV Experiments. Journal of Environmental Engineering 129, pp 209-215
- Rosenfeldt, E.J. and Linden, K.G., 2007. The ROH,UV concept to Characterise and Model the UV/H2O2 Process in Natural Waters, Environmental Science and Technology 41, pp 2548-2553
Contact: Bram J. Martijn, bram.martijn@pwnt.com;
Joop C. Kruithof, joop.kruithof@planet.nl