

By Jaime Quintanaa, Antonio A. Fernández-Balbuenaa, Juan Carlos Martínez-Antóna, Daniel Vázqueza, Luis Pradab, Luis Estradab, Javier Aldaa*
a. Applied Optics Complutense Group, University Complutense of Madrid, Av. Arcos de Jalón, 118, 28037 Madrid, Spain
b. Luminalia Ingenieria y Fabricación, P.I. de Granda, Siero, 33199 Asturias, Spain
* corresponding author
The inactivation of pathogens through the irradiation of ultraviolet light depends on how light propagates within the medium where the microorganism is immersed. A simple geometrical optics analysis and a fluence evaluation reveal some reservoirs where the pathogen may hide and be weakly exposed to the incoming radiation. These geometrical hideouts also generate a tail in the plot of the total inactivation plot vs. the incoming fluence.
The authors have analyzed these facts using geometrical optics principles and illumination engineering computational packages. The results obtained from previous biomedical measurements involving SARS-CoV-2 have been used to evaluate the inactivation degree for a spherical geometry applicable to airborne pathogens and for a spherical cap geometry similar to that used in biomedical experiments. The case presented here can be seen as the worst-case scenario applicable under collimated illumination.
1. Introduction
Triggered by the onset of the COVID-19 pandemic, several strategies to disinfect pathogens have been revisited and applied to inactivate the SARS-CoV-21-6. Among them, the known capability of germicidal UV-C sources7 has been applied to the case of SARS-CoV-2.8,9 The detailed analysis of the culture medium used for the assays has revealed the importance of optical concepts under UV irradiation. Optical absorption, parameterized through the absorption coefficient, is one of the main factors when evaluating the intrinsic, characteristic fluence for inactivation. Geometry is the other one. Actually, geometry has been analyzed in some other previous papers where the appearance of menisci at the outer free surface of the culture medium cast shadows on the medium itself.4,7,10-13
If active homogenization is not possible during UV irradiation, the presence of unexposed volumes should be considered when analyzing the results of the UV inactivation strategies. In practice, some of the UV-inactivation assays require the irradiation of virus-containing droplets deposited on a flat substrate and illuminated with an almost collimated light source. Besides, some culture media used in these analysis (e.g., Dubelcco’s Modified Eagle Medium) have a non-negligible absorption coefficient that diminished the available UV-C radiation for inactivation. When the virus is considered airborne, the medium takes the shape of a sphere, and before desiccation the medium is aqueous. In any case, the propagation of light within the medium is relevant to account for the disinfection level. To properly address these issues, geometrical optics, ray tracing and illumination engineering design packages may help to understand better how light moves through the sample.9,14
It is known that the inactivation of RNA virus follows an exponential law.7,15,16
where η is the fraction of surviving pathogens observed for a fluence level, F, being Fi the characteristic fluence of the virus at the given UV-C wavelength, λ. Some authors refer Fi as FD63, meaning that the surviving ratio has dropped until 1∕e = 0.37 when the fluence is Fi. This intrinsic parameter should be independent of the virus environment (geometry, culture medium, etc.) and could be used to evaluate the surviving rate in other situations. The results obtained from the geometry and computational evaluation provide a local value of the fluence within the volume of interest. By doing so, F = F(x, y, z) and the surviving ratio η = η(x, y, z) becomes local.17 This local inactivation is used to analyze the exposure level of each region of the volume of interest.
In this contribution, a simple geometrical optics model has been considered to understand better the behavior of light for two of the geometries involving curved surfaces (Section 2). In this section, the results from an illumination engineering computational package are used to determine the local fluence. In Section 3, the global surviving ratio is calculated and provides a simple geometrical explanation for the presence of significant tails in the inactivation curves, revealing physical hideouts for the pathogen. The main conclusions of this manuscript are given in Section 4.
2. Geometrical model
Geometrical optics is likely one of the most powerful tools when sketching how light propagates and behaves in optical systems. Its simplicity makes it possible to perform back-of-the-envelope calculations and drawings that show the first approach to find the location and size of objects and images transformed by diopters, mirrors and lenses. Geometrical optics also is the backbone of optical design packages widely used by optical engineers on a daily basis. In particular, illumination engineering merges geometrical optics with optical energy evaluations to understand how radiant flux moves through materials. This is why geometrical optics were chosen as the first step in the model. Even more, the paraxial approach of geometrical optics makes it possible to locate points of relevance in the propagation of the energy from the source, as focal points.18-20
In this analysis, two basic geometries are considered: a sphere filled with water, and a droplet filled with culture medium and deposited on a flat substrate. The sphere is a first approximation to an aqueous airborne pathogen’s container. Although the size of the sphere changes depending on environmental variables, the authors assume in this analysis that the spherical shape remains invariant. The droplet geometry (modeled as a spherical cap) appears in biological assays where the culture medium is deposited on a flat substrate. Some other geometries include cylindrical vessels and Petri dishes.10
An optical artifact involved in cylindrical vessel is the formation of menisci at the air/liquid interface. Their importance at the outer region of the free surface of the liquid depends on the ratio between the menisci’s radius and the diameter of the cylindrical vessel. Some interesting calculations have been made to analyze the effect of menisci formation in biological experiments.10 The calculation does not include this effect because the authors are more interested in the validation of computational tools for the analysis of the UV-C interaction with pathogens immersed in optical media.13 In this section, once the geometry is fixed, an illumination engineering package, TracePro, will be used to evaluate the relative local fluence that will be used to model the global surviving ratio of the sample.
2.1. The sphere
From a geometrical optics point of view (see Figure 1a), the sphere can be seen as the composition of two diopters having a radius r1 = −r2 = r, that interface between the surrounding medium n1 = n ′2 = na, that is assumed to be air (na = 1), and the inside medium, n ′1 = n2 = nw, that the authors consider as water (nw = 1.35 at λ = 254 nm). After some algebra using the paraxial approach, the focal length of the water sphere as
meaning that light will focus behind the sphere at a distance s′2,sphere = f′sphere − r from the back vertex of the sphere. The large increase in flux associated with the focal point happens outside the sphere and has no influence on the inactivation process. On the other hand, part of the light entering the sphere is reflected from the back surface of the sphere, which acts as a mirror. Now, the calculation involves a refraction to enter the sphere plus a reflection. Therefore, an inner focal point appears at
This effect generates a focusing point within the sphere that could be of help with considering the local inactivation factor. Actually, the reflected light propagates toward the input surface #1, and generates an additional focal point in reflection that occurs outside the sphere. This paraxial calculation already shows large inhomogeneities of the irradiance within the drops. Successive reflections can be considered that contribute less and less to the local irradiance within the sphere. In this contribution, the authors have evaluated these reflections using TracePro (TracePro is a product of Lambda Research Corporation, Littleton, Massachusetts).
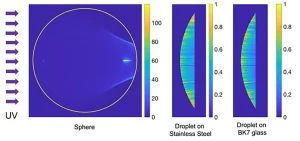
Figure 2 shows the irradiance maps obtained from TracePro when using a collimated source. These maps already reveal how a non-negligible portion of the sphere only received a faint contribution from the successive and weaker reflections within the sphere. For the spheric geometry, the caustic defines a region that is not illuminated by the incident light refracting at the input surface of the sphere.
Analytically, this caustic can be obtained by evaluating the height of the ray at the output surface, ℎ ′, as a function of the height at the input surface, ℎ, that is:
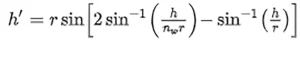
For the case treated here, ℎ′ reaches a maximum of ℎ′ = 034r when ℎ = 0.85r. The region defined by the caustic defines a geometrical hideout for the pathogen that helps to explain the tail of the inactivation curve (see Section 3).
When including the geometry of the sphere in a computational ray-tracing package (TracePro), the distribution of the optical flux within the sphere can be obtained for specific illumination conditions. In this case, the authors have chosen a collimated source generating parallel rays impinging on the spherical sample. The results are shown as a dimensionless relative irradiance distribution, e(x, y, z) in Figure 2a.
2.2. The spherical cap
The geometrical analysis of the droplet having a spherical cap shape is quite simple (see Figure 1b). Now, the medium is the culture solution where the pathogen is living. Although important from the radiometric point of view, the presence of absorption does not affect the location of the focal points of the system.
From a geometrical optics point of view, this case corresponds with a plane convex lens made of culture media. As it happens with the sphere, the flat interface between culture medium and substrate reflects light toward the droplet, increasing the total flux that propagates through the sample. Moreover, the reflectivity of the substrate may be relevant when calculating the local fluence. The optical parameters of the sample can be calculated through the paraxial approach to obtain a focal distance
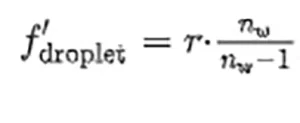
that is located at a distance s ′2,droplet = f ′droplet −ℎ from the flat surface of the droplet. To complete the paraxial analysis of the sample, the authors have calculated the location of the focal point obtained after light reflects at the flat surface:
Again, the algebraic analysis of successive reflections does not contribute significantly to the explanation of the inactivation process. Moreover, these effects are included in the computational evaluation of the relative irradiance, e(x, y, z) (Figures 2b and c).
3. UV inactivation tails and limits
In Section 1, the inactivation process was described as an exponential decay of η in terms of the fluence arriving to the sample (see Formula 1). In the previous section, the relative distribution of irradiance within the sample has been plotted. This dimensionless distribution can be transformed into irradiance just by fixing the input irradiance, F0. Then, after multiplying it by the exposure time, the fluence value is obtained. Therefore, the maps in Figure 2 also can be interpreted as a relative fluence distributions.
The calculation of the total inactivation requires the average of the local inactivation map within the sample
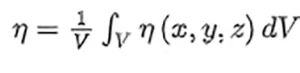
where V is volume of the sample, and η(x, y, z) = exp(−F(x, y, z)∕Fi), where the local fluence is defined as
![]()
where E0 is the irradiance reaching the sample, and e(x, y, z) is the dimensionless relative irradiance distribution. The value of F0 depends on the irradiance arriving to the sample, E0, and the time exposure, texp, as F0 = E0 texp.
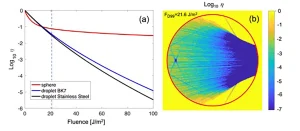
In Figure 3a, the inactivation (in log10 scale) of the pathogen has been plotted using a value for the characteristic fluence Fi = 4.7 J/m2 that is valid for the SARS-CoV-2 at λ = 254 nm. This value has been obtained after exposing the virus immersed in an absorbing culture medium (DMED) to UV-C irradiation produced by low pressure Hg lamps.13 The case of the sphere shows a quite significant feature where the inactivation rate drops very sharply for low fluences and generates a quite high inactivation tail above -2, meaning that for collimated illumination conditions the inactivation level of 99% would require a large amount of fluence (large irradiance or large exposure time).
In a practical case, the collimated illuminated conditions are not fulfilled and the UV-C sources are arranged as extended sources. Moreover, some solutions used in UV-C disinfection strategies include reflecting surfaces. Therefore, the collimated source should be taken as the worst-case scenario. For the droplet geometry, the inactivation evolution for the dielectric and metallic substrates in Figure 3 can be distinguished. It is clear that the metallic substrate is able to redirect the energy again toward the sample and generate a larger inactivation than the dielectric case.
The behavior of the spherical geometry is illustrated in Figure 3b where the authors have plotted the local inactivation for a value of fluence of FD99 = 21.6 J/cm2 that would correspond to an inactivation level of 99% (−2 in Log scale) if the naked SARS-CoV-2 were directly irradiated by UV-C at λ = 254 nm. This fluence level also is represented in Figure 3a as a vertical line. It can be seen that there is a region around the inner focal point where the local inactivation is larger than 99.9% (−3 in Log scale). However, there is a quite significant volume where the inactivation is lower than 50%. After some calculations, for the case presented in Figure 3b, this volume portion with an irradiance lower than FD50 is around 7.13%. This portion can be seen as a geometrical reservoir for the pathogen.13
4. Conclusions
The capabilities of the UV-C irradiation techniques have been positively proved for the inactivation of pathogens in a wide variety of circumstances. Previous studies have determined the characteristic fluence for inactivation of the SARS-CoV-2 at λ = 254 nm.
The use of geometrical optics principles in the paraxial approach helps to understand some basic mechanisms driving the propagation of light through materials and geometries that appear in the airborne propagation of pathogens, and in the biochemical techniques that measure the capabilities of UV-C disinfection strategies. The geometrical model also is present in the computational evaluation of the propagation of radiant energy. This modeling defines a local fluence distribution that helps to determine the inactivation curve as a measurement of the surviving ratio vs. the energy impinging on the medium.
The authors have shown some geometric reservoirs of pathogen where the irradiation does not reach a significant level, meaning that a non-negligible fraction of microorganisms remain underexposed. This fact explains the tail of the inactivation curve. This situation can be considered as the worst-case-scenario that can be improved by an appropriate use of non-collimated light coming from extended sources, or by the use of reflective surfaces that modify the direction of incidence of the UV-C radiation. This is specially significant for spherical geometries. Also, the behavior of droplets deposited on a plane substrate depends on the characteristics of the substrate. The authors have found that a metallic surface inactivates more pathogens than a dielectric substrate. This is caused by the larger reflection coefficient of the metallic material in comparison with the dielectric one.
As a summary, the authors have shown how geometrical optics and illumination engineering packages can be of use when determining the overall inactivation of pathogens. They also have revealed the presence of geometrical reservoirs that could jeopardize the use of this technique for collimated sources. The existence of tails in the inactivation curve is merely explained by the geometry of the light propagating through the media. Moreover, the effect of the optical properties of the substrate and the culture medium that is used in biomedical experiments involving droplets deposited on plane substrates has been evaluated.
Therefore, this contribution may help researchers to understand the limits of the UV-C pathogen’s inactivation methods and propose a way to surpass those limits and include the propagation of light within the analysis of the inactivation data. Although applied to the case of SARS-CoV-2, this methodology can be extended for any other case of pathogen, geometry or culture medium.
Acknowledgments
This work has been partially supported by Project COV20-01244-CM funded by the Comunidad de Madrid, and by a research grant (#171-2020) between Luminalia Ingeniería y Fabricación and the University Complutense of Madrid.
References
- M. Weiss, M.C. Horzinek, Resistance of berne virus to physical and chemical treatment, Vet. Microbiol. 11 (1) (1986) 41–49, http://dx.doi.org/10.1016/ 0378-1135(86)90005-2, URL https://www.sciencedirect.com/science/article/pii/0378113586900052.
- J. Zhang, T.A. Davis, M.A. Matthews, M.J. Drews, M. LaBerge, Y.H. An, Sterilization using high-pressure carbon dioxide, J. Supercrit. Fluids 38 (3) (2006) 354–372, http://dx.doi.org/10.1016/j.supflu.2005.05.005, URL https://www.sciencedirect.com/science/article/pii/S0896844606000027.
- H. Kariwa, N. Fujii, I. Takashima, Inactivation of SARS coronavirus by means of povidone-iodine, physical conditions and chemical reagents, Dermatol. 212 (suppl 1) (2006) 119–123, http://dx.doi.org/10.1159/000089211, URL https://www.karger.com/DOI/10.1159/000089211.
- E.I. Patterson, T. Prince, E.R. Anderson, A. Casas-Sanchez, S.L. Smith, C. Cansado-Utrilla, L. Turtle, G.L. Hughes, Methods of inactivation of sars-cov-2 for downstream biological assays, https://doi.org/10.1101/2020.05.21.108035, bioRxivarXiv:https://www.biorxiv.org/content/early/2020/05/23/2020.05.21. 108035.full.pdf, URL https://www.biorxiv.org/content/early/2020/05/23/2020.05.21.108035.
- M. Hessling, K. Hoenes, C. Lingenfelder, Selection of parameters for thermal coronavirus inactivation – a data-based recommendation, GMS Hyg. Infect. Control. 15 (32733781) (2020) Doc16–Doc16. URL https://www.ncbi.nlm.nih.gov/pmc/articles/PMC7373095.
- G. Kampf, D. Todt, S. Pfaender, E. Steinmann, Persistence of coronaviruses on inanimate surfaces and their inactivation with biocidal agents, J. Hosp. Infect. 104 (3) (2020) 246–251, http://dx.doi.org/10.1016/j.jhin.2020.01.022, URL https://www.sciencedirect.com/science/article/pii/S0195670120300463.
- W. Kowalski, Ultraviolet Germicidal Irradiation HandBook: UVGI for Air and Surface Disinfection, Springer science & business media, 2010.
- M. Raeiszadeh, B. Adeli, A critical review on ultraviolet disinfection systems against COVID-19 outbreak: Applicability, Valid. Saf. Consid. ACS Photon. 7 (11) (2020) 2941–2951, http://dx.doi.org/10.1021/acsphotonics.0c01245, arXiv:10.1021/acsphotonics.0c01245.
- M. Hessling, K. Hönes, P. Vatter, C. Lingenfelder, Ultraviolet irradiation doses for coronavirus inactivation – review and analysis of coronavirus photoinactivation studies, GMS Hyg. Infect. Control 15 (2020) Doc08.
- R. Sommer, A. Cabaj, D. Schoenen, J. Gebel, A. Kolch, A.H. Havelaar, F.M. Schets, Comparison of three laboratory devices for UV-inactivation of microorganisms, Water Sci. Technol. 31 (5) (1995) 147–156, http://dx.doi.org/10.1016/0273-1223(95)00256-M, health-Related Water Microbiology 1994. URL https://www.sciencedirect.com/science/article/pii/027312239500256M.
- A.E. Beggs C.B., Upper-room ultraviolet air disinfection might help to reduce covid-19 transmission in buildings: a feasibility study, PeerJ, https: //doi.org/10.7717/peerj.10196.
- C.S. Heilingloh, U.W. Aufderhorst, L. Schipper, U. Dittmer, O. Witzke, D. Yang, X. Zheng, K. Sutter, M. Trilling, M. Alt, E. Steinmann, A. Krawczyk, Susceptibility of SARS-CoV-2 to UV irradiation, Am. J. Infect. Control 48 (10) (2020) 1273–1275, http://dx.doi.org/10.1016/j.ajic.2020.07.031, URL https://www.sciencedirect.com/science/article/pii/S0196655320307562.
- J.C. Martínez-Antón, A. Brun, D. Vázquez, S. Moreno, A.A. Fernández-Balbuena, J. Alda, Determination of the characteristic inactivation fluence for sars-cov-2 under uv-c radiation considering light absorption in culture media, Sci. Rep. 11 (1) (2021) 15293, http://dx.doi.org/10.1038/s41598-021- 94648-w.
- M. Buonanno, D. Welch, I. Shuryak, D.J. Brenner, Far-uvc light (222 nm) efficiently and safely inactivates airborne human coronaviruses, Sci. Rep. 10 (1) (2020) 10285, http://dx.doi.org/10.1038/s41598-020-67211-2.
- J. Hadi, M. Dunowska, S. Wu, G. Brightwell, Control measures for SARS-CoV-2: a review on light-based inactivation of single-stranded RNA viruses, Pathogens, 9(9), https://doi.org/10.3390/pathogens9090737, URL https://www.mdpi.com/2076-0817/9/9/737.
- M. Hessling, R. Haag, N. Sieber, P. Vatter, The impact of far-uvc radiation (200-230 nm) on pathogens, cells, skin, and eyes – a collection and analysis of a hundred years of data, GMS Hyg. Infect. Control 16 (2021) Doc07.
- W. Hijnen, E. Beerendonk, G. Medema, Inactivation credit of uv radiation for viruses, bacteria and protozoan (oo)cysts in water: A review, Water Res. 40 (1) (2006) 3–22, http://dx.doi.org/10.1016/j.watres.2005.10.030, URL https://www.sciencedirect.com/science/article/pii/S004313540500610X.
- J.E. Greivenkamp, Field guide to geometrical optics, SPIE (2004).
- E. Hetch, Optics, fifth ed., Pearson, 2016.
- D. Malacara-Hernández, B.J. Thompson, Fundamentals and Basic Optical Instruments, Taylor and Francis, 2017