
By Tatiana Koutchma, Katja Auer, Peter Gordon, Britt Hafner and Richard Mariita, UV4Good
The development of novel germicidal ultraviolet (GUV) light sources opens opportunities for innovative disinfection applications and allows for selecting wavelengths to achieve desired effects while improving safety and quality of GUV sources emitting light in continuous or pulsed modes with different spectral outputs and intensities. These variances create a challenge in comparing their germicidal, electrical, optical and other performance efficacy. Therefore, selecting the appropriate light sources and wavelength(s) for various applications in liquids and on solid surfaces requires a deeper dive into their characteristics.
The primary goal of this article is to briefly present existing and emerging trends in GUV generation by continuous and pulsed lamps and LEDs, and to present examples of metrics for their performance and operating characteristics, providing a comparison that includes wall-plug efficiency, fluence-response data and electrical efficiency per order for GUV sources. Understanding these features enables better design choices for integrated systems that utilize and direct photonic output toward contaminated targets, such as water and liquid products, hospital surfaces, food packaging, agricultural produce handling and transport, pharmaceutical cleanroom walls and personnel, and air flow within rooms and in air-handling units.
The secondary goal is to promote the implementation of scheduled GUV monitoring of the sources once installed into facilities providing microbial reduction and, in the case of GUV, for cooling-coil maintenance in air handlers and energy-savings solutions. Monitoring is a long-overdue quality assurance necessity valued by stakeholders and decision makers. Measuring, monitoring and, ultimately, fine-tuning photon control optimize return on investment (ROI), leading to broader adoption of this technology.
Conventional GUV sources
Continuous low-pressure mercury (LPM) and amalgam lamps (LPA) that emit monochromatic UV-C light at 253.7 nm traditionally are used in commercial disinfection and decontamination practices for water, air, healthcare applications, foods and beverages. These sources have the highest electrical efficiency (up to 40%), longest lifetime and lowest cost. Limitations of these lamps include 1) risk of glass or mercury contamination if the lamp is broken, 2) potential undesirable effects on human skin and eyes following exposure and 3) monitoring lamp temperature.

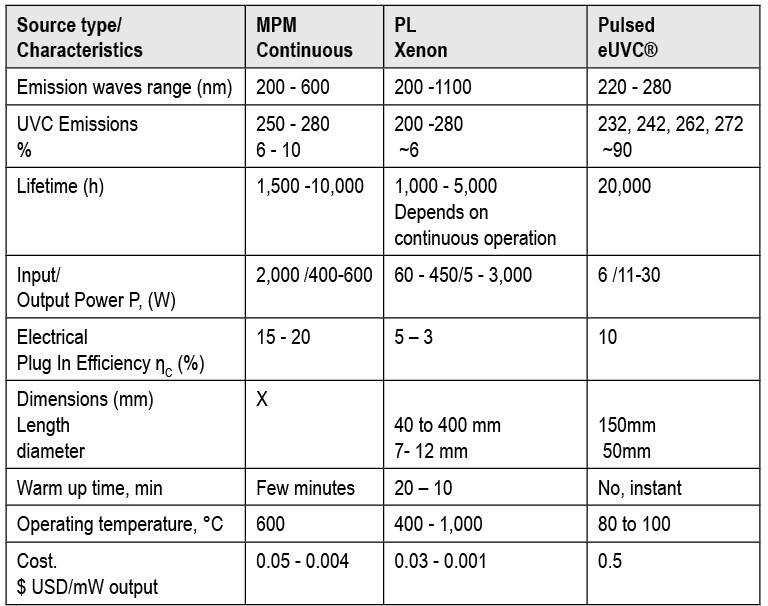
Medium-pressure mercury (MPM) lamps are polychromatic and can generate powerful, continuous ultraviolet light characterized by hundreds of Watts in a broad band of UV-C, UV-B and UV-A (200-390 nm) and visible (400-600 nm) light emission spectrum range. Although MPM lamps can generate higher intensity levels of GUV irradiance and fluence rates than LPM lamps, MPM lamps have limited applications due to high operating temperatures (600° C-900° C), requiring built-in water or air cooling. Additional barriers include non-uniform light output, higher cost and lower electrical efficiency than LPM lamps.
Pulsed light (PL) xenon lamps emit a broadband light delivered in a series of short, high-intensity pulses. PL is characterized by a polychromatic spectrum that includes UV light (100-400 nm), visible light (400-700 nm) and a portion of the near-infrared (NIR) spectrum (700-1100 nm) which can generate some heat. By utilizing controlled high irradiance, xenon PL can deliver energy in three pulses per second, with a pulse width of 360 μs and fluence levels higher than 1000 mJ/cm2 per pulse. Xenon PL is studied frequently and commercialized for a variety of disinfection applications in air, water, healthcare and food applications.
Emerging GUV sources
In recent years, novel GUV sources – such as light-emitting diodes (LEDs), pulsed electron lamps and excimer lamps (EL) – have been developed, tested and commercialized.
Typically, UV LEDs are manufactured at nearly monochromatic single operating wavelengths (e.g., 255, 265, 275, 280, 365 and 385 nm). UV LEDs manufactured at longer UV-A wavelengths have the highest efficiency, dropping below 365 nm. Continual development of LEDs has improved the performance of UV-B and UV-C LEDs at 265-280 nm, which currently are the most cost-effective with the highest output power. Essential distinctions between arc lamps and LEDs involve optical geometries, shape, size and light direction (360o for lamps and 180o for LEDs). LPM lamps have an intense, narrow emission peak, while UV LEDs emit relatively low-intensity GUV with a broader emission peak.
The interest in EL has been focused on krypton-chloride excimer (KrCl*) lamps that typically exhibit a primary peak at 222 nm. Research and testing of EL at 222 nm is increasing due to its high antimicrobial efficacy in combination with increased safety for humans as compared to 254 nm lamp technologies.
A summary of the technical characteristics of continuous monochromatic GUV lamps and LEDs, including wavelength spectra, lifetime, wall-plug efficiency, operating temperatures and approximate costs collected from manufacturers, is presented in Table 1. As mentioned, the more designers understand the capabilities of GUV sources, the better they can choose which sources are best for the desired application.
Pulsed electron UV-C tubes (eUVC®), based on established principles, are a developing technology using phosphors, the luminescent material that produces UV-C germicidal photons. 7 The typical pulse of an eUV-C lamp and emission spectra has four emission peaks at 232, 242, 261 and 272 nm. The main advantage of a pulsed eUV-C lamp is the emission of 90% UV in the UV-C range compared to conventional continuous MP and PL xenon lamps with UV-C emission ranging from 5 to 6%. A summary of the technical characteristics of broadband continuous and pulsed lamps is presented in Table 2.
Metrics for the Evaluation of GUV Source Efficiency
The efficiency of GUV sources and systems can be compared using three metrics:
- Wall-plug electrical efficiency basis (WPE)
- Fluence-response basis
- Electrical energy per order basis (EEO)
Wall-plug Electrical Efficiency
Wall-plug electrical efficiency, or WPE, describes the conversion of electrical power to optical power. 3 WPE is calculated as a simple ratio of optical output power (Pout)to total electrical input of UV light sources (Pin)(see Equation 1) and presented in Tables 1 and 2.
ηC = 𝑃𝑜𝑢𝑡/𝑃𝑖𝑛 (Equation 1)
This metric typically is reported by lamp manufacturers based on the input wattage necessary to power the source and the optical power generated by the same source as measured in an integrated sphere. UV-C power output is an inherent property of the UV source and is measured in Watts. LPM lamps have the highest WPE or ηC (30-40%), followed by MPM lamps (15-20%), EL (3-7%) and UV LEDs (5-10%). LPM and MPM have been widely used in water treatment, primarily due to their high WPE. The lower WPE of UV LEDs and KrCl* EL can be a significant challenge in considering them as an alternative light source to mercury lamps. Although this metric is useful for assessing the efficiency of electrical to optical power conversion, it does not consider the input power consumption of the entire UV system, which often is higher than the input power of the UV lamp itself. Measuring the actual input power consumption of the whole integrated system is recommended.
Fluence-response Data
Fluence-response basis permits direct evaluation of the effects of fluence and treatment wavelength on a microbial or chemical response to ultraviolet light (UV). The fluence-response to UV exposure is determined by the following microbiological, UV source and application properties:
- Action spectrum of the microorganisms or their UV-C spectral sensitivity
- Source characteristics
- Wavelength, UV output, incident fluence delivered to the application
- Application characteristics
- Absorbed fluence (UV energy/unit area, in J/m2 or mJ/cm2), defined by the application
- Surfaces: distance to the surface and number of UV sources, material surface characteristics and its reflection
- Air: ambient temperature, humidity, circulation
- Liquids: UV absorbance and transmittance, pH, composition, viscosity, flow rate
Evaluation of incident fluence on a surface differs for continuous and PL sources. The incident UV-C fluence determines how much of the UV-C output reaches the object from a single or multiple sources and is measured in mJ/cm2. In general, for continuous sources, incident fluence H0 can be evaluated using Equation 2.
H0 = I0 x t (Equation 2)
where Io is an incident UV light intensity of sources per unit area, W/m2 or mW/cm2 at a certain distance, and t is exposure time t (s).
In the case of PL, incident fluence HoPL is a function of the number of pulses and the peak power of the single pulse averaged over the number of pulses per single or 1-pulse time (see Equation 3).
H0PL = I0PL x 1-pulse time x n (Equation 3)
where I0PL is the incident average UV irradiance of a single pulse and n is the number of pulses during the total exposure time.
In the case of continuous emission, the detailed determination of other treatment parameters for liquids, such as volume averaged absorbed fluence for high and low UV transmission liquids, is described by Koutchma. 4 As described earlier, these values are dependent on the target, the treatment medium or surface, and the source.
Microbial response to GUV exposure can be compared based on DUV fluence; that is, the effective energy required to reduce the concentration of target microorganisms by a specific log reduction ratio, S, where S = Log (N/N0), N and N0 are final and initial concentrations of microorganisms, CFU/mL. For microbial targets, these values typically are expressed as the D10 dose necessary to achieve 1-log10 (1D) and/or 5-log10 (5D) reduction. In the case that the microbial response follows a first-order reaction kinetics, fluence or Duv can be calculated using Equation 4.
DUV=D10 x S (Equation 4)
D10 is the fluence in mJ/cm2 to achieve 90% microbial reduction. D10 value characterizes UV-C sensitivity of microorganisms to the specific wavelength of a UV source. D10 value commonly is reported as a critical UV-C inactivation parameter that relates only to the spectrum emitted by the source as applied to the disinfection system. In the case when the UV microbial inactivation follows the first-order reaction, D10 value can be calculated knowing the inactivation rate parameter k (cm2/mJ) found from the slope of the survival profile (see Equation 5).
D10=2.3/k (Equation 5)
Since microbial target reduction by GUV often is non-linear, kinetic modeling is required to determine the fluence necessary to achieve desired levels of reduction. Kinetic models can account for tailing or shoulder effects often observed during microbial inactivation. 5 The efficiency of GUV treatments depends on the spectral sensitivity of the target microorganism, rather than the source. Germicidal effectiveness on a fluence basis improves for wavelengths that correspond closely to the peak absorbance of both nucleic acids and cellular proteins near 260 to 280 nm and below 230 nm, respectively. 8 The inactivation rate constants of microorganisms were reported for GUV at different wavelengths in water, food liquids and beverages; however, it is difficult to obtain accurate UV-sensitivity data (k-values) because of the differences in GUV treatment conditions, calculation approaches and microbial physiological states.
Electrical Energy per Order
Although fluence-based evaluation of GUV microbial efficiency allows comparison among different sources, it cannot be used to assess the overall energy and economic efficiency of the integrated systems. The third metric of electrical energy per order (EE0) was introduced as an all-encompassing way to compare the electrical efficiency of light sources during treatments. 1,2 It is expressed as the total electrical energy (Wh) required for a specific target reduction per volume or surface area (see Equation 6).
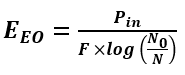
(Equation 6)
where Pin is the total electrical input power (W); F is the volumetric flow rate (m3/h), N0 is the initial microbial concentration (CFU/ml) and N is the final microbial concentration (CFU/ml). This metric has been reported by numerous authors for the evaluation of microbial UV-C treatments. 9 The important objective of this metric is to allow commercial UV users to compare the economic effect ($) of different UV light sources for a particular treatment. It should be noted that EE0 cannot predict the efficiency at which GUV is delivered to the target, the effect of medium on target reduction, nor the UV-C sensitivity of the target. Hence, EE0 should be used primarily to compare the energy efficiency of sources for the reduction of a similar target, in similar treatment conditions, using identical photon delivery approaches. A lower EE0 is synonymous with a more energy-efficient GUV system.
In the case of UV light batch treatments, EEO can be calculated using Equation 7.
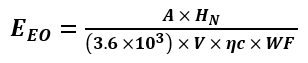
(Equation 7)
where A is the irradiant surface area (cm2), HN is the fluence required to achieve required log reduction (mJ/cm2), 3.6 ×10³ is a unit conversion constant for W and kW, V is the volume of sample being treated (mL or cm3), c is the wall-plug efficiency, and WF is the water factor previously described by Bolton and Linden. 2
In this review, the authors propose using modified versions of the EE0 determination, which have been simplified and can be used to determine electrical efficiency in both batch and continuous GUV surface treatment systems (see Equation 8). 6
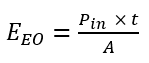
(Equation 8)
*TN is an evaluation metric evaluating the ability of the disinfection system to utilize all the UV light output. It is equivalent to an effective distance describing the range of UV-C irradiating a fluid. A larger value indicates a more efficient system design.
where t is the treatment time needed to achieve the required reduction of processing target (s); A is the maximum light exposure area in the specified treatment setup (cm2). In this case, input electrical power either can be measured directly for the entire GUV system (Pin system) using an electricity monitor, such as the Kill A WattÓ (P3 International; NC, USA) or it can be reported based on the input UV lamp power specified by the manufacturer (Pin lamp). The measurement of Pin system is essential because GUV systems typically require higher input power than what is required for the lamp itself (Pin lamp). This often is due to the requirement for additional electrical components, such as heat dissipation for optimal operation of the light source. It is important to note that the Pin system can be manufacturer- or user-specific. For this reason, the authors encourage the reporting of both Pin system and Pin lamp and the subsequent calculation of system-based and lamp-based EE0. When calculating multiple lamp systemEE0, Pin lamp should be multiplied by the total number of lamps in the system.
It should be noted that the product of Pin and treatment time results in the value of total electrical energy that is consumed to achieve a desired target reduction using a specific GUV delivery set-up and is expressed in Watts per unit of time. For most systems, W.s or W.h often are used to describe total electrical energy. Treatment time to achieve a required processing target accounts for the optical power output of the system, or the efficiency of photon delivery to the target, the UV-C sensitivity of the target and the effect of the treatment medium. The final term, maximum light exposure area, is necessary to account for the dimensions and geometry of the source. The resulting EE0 metric is expressed as W.s/cm2/per specific log reduction.
Additionally, the efficiency metric for continuous flow system ηR can be used to evaluate the utilization ratio of the output of the source by the system for treatment of liquids (see Equation 9).
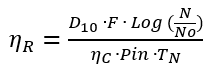
(Equation 9)
where F is the volumetric flow rate (m3/h); TN (m3/cm2) is the nominal thickness unit (included to normalize the dimensions); ηC = Pout /Pin × 100% (Eq. 1); Pin is the electrical power of a source.
Using the above equations, EEO can be rewrittenas follows (see Equation 10).
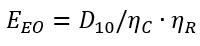
(Equation 10)
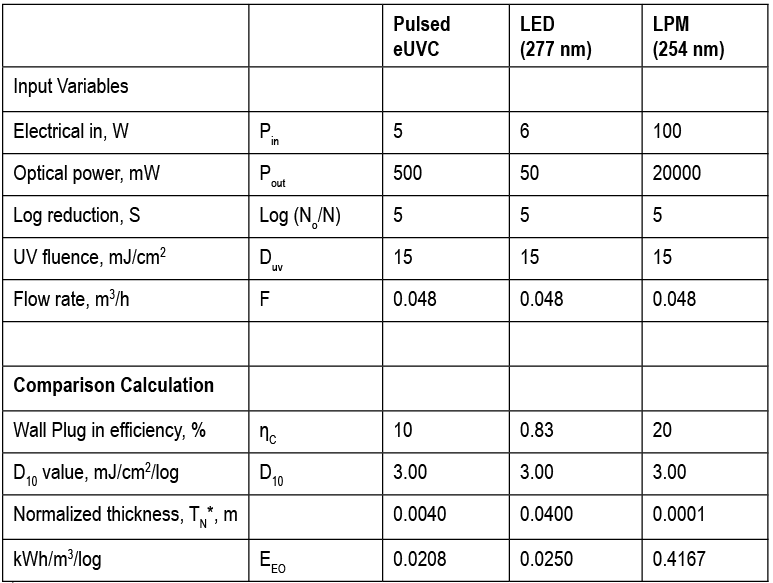
When EEO iscalculated using Equation 10,it allows evaluating the effect of the source WPE, the germicidal efficacy of the source spectrum or wavelength, and the design of the germicidal treatment system. Generally, the WPE of a source is provided by the manufacturer, and the wavelength efficiency as D10 value can be found from lab testing of microbial fluence-response data. GUV equipment manufacturers can evaluate the performance of a source based on these data to determine flow systems with the best performance. Examples of EEO calculations for LPM, LED and PL sources are given in Table 3. In the case of similar UV-C sensitivities or D10 values (no effect of wavelength) at the same flow rate, the highest value of EEO was found for the LPM lamp due to the highest value of WPE. Clearly, that performance of pulsed eUV-C and LEDs systems can be improved with the improvements in their WPE.
Conclusion
GUV-based technologies are emerging as nonthermal, dry, nonionizing and nonchemical techniques that have much to offer for sustainable development of UV-C disinfection-targeted applications at multiple wavelengths. However, there is no common approach to compare and select the most efficient wavelength and energy-efficient UV light source or integrated system. The reviewed metrics to measure and evaluate sources, such as WPE, fluence response data, source and system electrical efficiency per order, can be used as essential approaches for performance comparison of pulsed and continuous sources in batch and continuous modes for surface and liquid treatment systems. These metrics offer a systematic approach for selecting the most cost-effective and energy-efficient GUV source(s) for targeted wavelength applications based on their operational mode and optimal wavelength for microbial or chemical targets. This approach achieves optimal system performance in terms of electrical energy per order and contributes to future developments of GUV integrated systems. Once systems are installed, UV monitoring, based on photodiodes or photochromatic cards, should be deployed to verify and validate proper installation, aiding in the improvement of indoor air quality, hospital or cleanroom surface decontamination, food product and liquid safety, and HVAC energy savings. Ongoing assurance drives confidence that GUV sources are functioning properly.
The authors declare that the article was prepared in the absence of any commercial or financial relationships that could be construed as a potential conflict of interest.
References and Resources
- Bolton, J. R., Bircher, K. G., Tumas, W., & Tolman, C. A. (1996). Figures-of-Merit for the Technical Development and Application of Advanced Oxidation Processes. Journal of Advanced Oxidation Technologies, 1(1), 13-17. doi:doi:10.1515/jaots-1996-0104
- Bolton, J. R., & Linden, K. G. (2003). Standardization of Methods for Fluence (UV Dose) Determination in Bench-Scale UV Experiments. Journal of Environmental Engineering, 129(3), 209-215. doi:doi:10.1061/(ASCE)0733-9372(2003)129:3(209)
- Heikkilä, O., Oksanen, J., & Tulkki, J. (2010). The challenge of unity wall plug efficiency: The effects of internal heating on the efficiency of light emitting diodes. Journal of Applied Physics, 107(3). doi:10.1063/1.3285431
- Koutchma, T. (2019). Ultraviolet Light in Food Technology: Principles and Applications. In (1st ed.). Boca Raton, FL: CRC Press.
- Peleg, M., & Cole, M. B. (1998). Reinterpretation of microbial survival curves. Crit Rev Food Sci Nutr, 38(5), 353-380. doi:10.1080/10408699891274246
- Popović, V., Matthew Newport, M., Asma Rahman, A, Koutrchma, T. Measuring the performance of conventional and emerging ultraviolet-C light sources for bacterial, fungal, and mycotoxin control. Food Control, Volume 165, November 2024, 110640
- Stevens, L. (2022). Technology Highlight: Deep Light Photonics Introduces High-Efficiency, Hg-Free UV-C Light Source. UV Solutions.
- Sun, W., Jing, Z., Zhao, Z., Yin, R., Santoro, D., Mao, T., & Lu, Z. (2023). Dose–Response Behavior of Pathogens and Surrogate Microorganisms across the Ultraviolet-C Spectrum: Inactivation Efficiencies, Action Spectra, and Mechanisms. Environmental Science & Technology, 57(29), 10891-10900. doi:10.1021/acs.est.3c00518
- Ward, D. M., Patras, A., Kilonzo-Nthenge, A., Yannam, S. K., Pan, C., Xiao, H., & Sasges, M. (2019). UV-C treatment on the safety of skim milk: Effect on microbial inactivation and cytotoxicity evaluation. Journal of Food Process Engineering, 42(4). doi: https://doi.org/10.1111/jfpe.12944